
This article describes the “openpyxl” library, which manipulates Excel in Python.
Since Excel is equipped with many functions, it is not possible to give a concise explanation in one article. This article is written as a series of articles divided by major topic.
In previous articles in this series, we have covered the essentials of using openpyxl.Please refer to the related articles as well, as some prior knowledge is required to read the following explanations.
For information on creating and saving a workbook, adding a worksheet, and then getting and manipulating rows, columns, cells, and objects, please refer to .

For cell formatting (fonts, borders, and other decorations), click here.

Now, in this article, the fifth in the series, we will show you how to manipulate “Conditional Formatting of Cells” in openpyxl.
One of the most important functions of Excel is data analysis.This “conditional formatting of cells” is part of that data analysis functionality.I will leave the details to specialized Excel books and websites, but it is easy to extract cells that contain data that meet certain criteria and to discover regularities.
Both “Python” and “Excel” excel at data analysis, and we will aim to improve the quality and efficiency of our work by using the features and useful functions of each.
In addition, please refer to the content structure of this series 【Python x Excel】 as shown here.Due to the extensive of the explanation, this article on “Conditional Formatting of Cells” will also be divided into two parts, the first part (this article) and the second part.
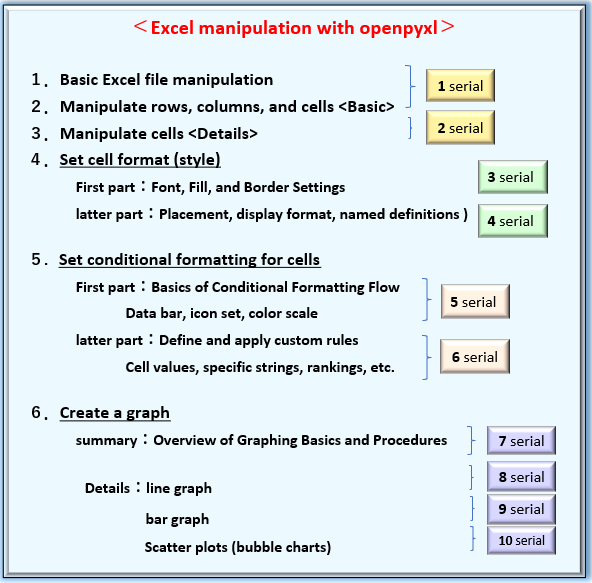
Please stay with us until the end of this article, as you will be able to “do and understand” the following
The information presented on this site is only an example. Please refer to the official website for details and clarifications, if necessary.
【Official Site】:https://openpyxl.readthedocs.io/en/stable/
We will now explain the procedures for applying “conditional formatting to cells” starting in the next section.
1. Set “Conditional Formatting” for Cells

I will now explain the procedure for setting conditional formatting on cells with “openpyxl”.
In this section, we will first give an overview of what conditional formatting is, and then explain the general “formatting flow (procedure)”.Then, I would like to organize the classes and objects needed to define the extraction conditions.
1.1 What’s Conditional Formatting ?
Conditional formatting is one of the data analysis functions provided by Excel.From the Excel menu, the settings window can be accessed via “Home Tab -> Style Group -> Conditional Formatting”.The settings window contains a variety of analysis items as shown in Fig2.
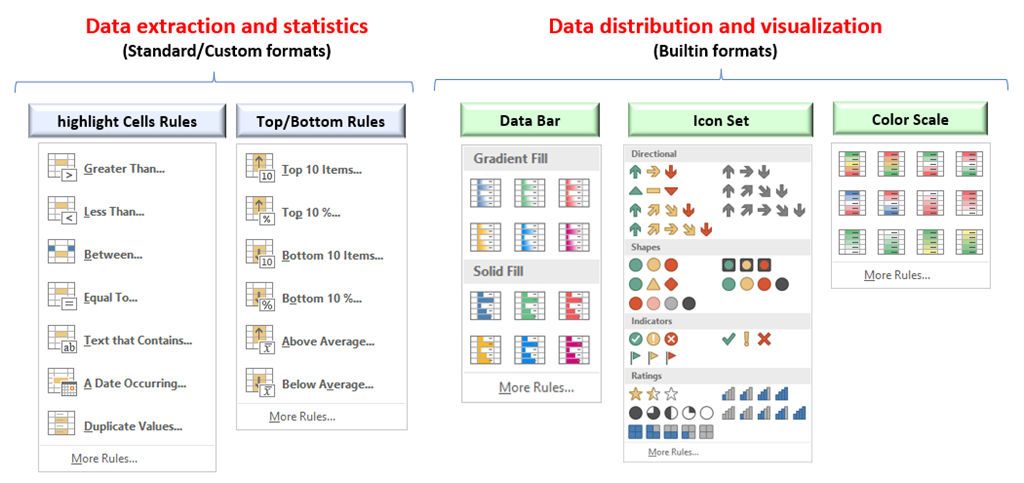
The analysis functions can be broadly classified into “data extraction and statistics” and “visualization of data distribution“.
The former is further divided into “Highlighting Rules” which extract cells that satisfy certain conditions, and “Upper and Lower Rules” which seek statistical rankings within a cell range.
(In the official documentation, they are classified as “Standard/Custom formats.)
The latter, on the other hand, consists of “Data Bar” “Icon Set” and “Color Scale” depending on the means of visualizing data distribution.(In the official documentation, they are classified as “Builtin formats.)
This article explains openpyxl, so this is the extent of the explanation of Excel functions.For other data analysis methods using Excel, please refer to the respective specialized books and websites.
1.2 How to apply Conditional Formatting
Defining and applying conditional formatting programmatically is a bit more complicated.
The core procedure for defining conditional formatting is to create a Rule object that summarizes the “what” and “how” conditions, such as cell selection and distribution.
The method of creating this Rule object must be selected appropriately, as the class to be used and its argument specifications are determined by the desired format.
In the following sections, we will first summarize the definition procedure flow, followed by a detailed explanation of the individual conditional formats.
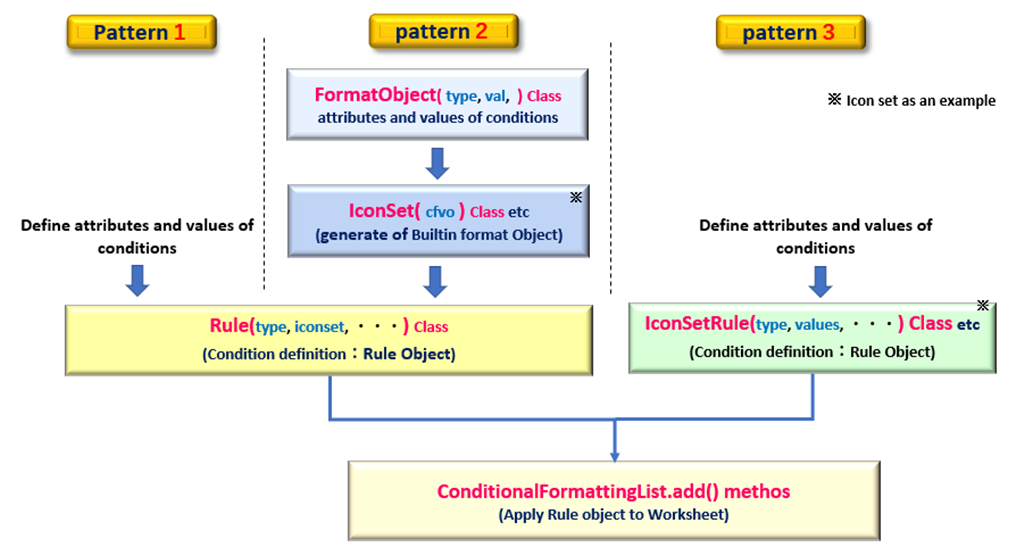
Fig3 below shows the steps (flow) to apply conditional formatting to a cell.
Thus, the procedure for generating Rule objects can be classified into three patterns, which must be selected appropriately according to the purpose.
<Three patterns for defining Rule Object>
Now, we will add an explanation for each definition pattern.(Please note that ”the designation Pattern〇” is for the author’s explanation and is not an official expression.)
「Pattern 1」Flow to create an object (constructor) by setting the extraction conditions directly in the argument of the Rule class (see below)
「Pattern 2」Flow to generate an object from a dedicated class prepared to define extraction conditions for Builtin formats (e.g. Data Bar) and set it as an argument of the Rule class (the most complicated)
「Pattern 3」This is a hybrid of Pattern 1 and Pattern 2.
The “generation of extraction condition definition objects” and “generation of Rule objects” can be handled together in a single class.However, the number of classes that can be supported is limited. (3 Builtin formats + others)
These are three different patterns.
Now, Fig4 summarizes the criteria for using “which patterns can define the analysis items of conditional formatting.
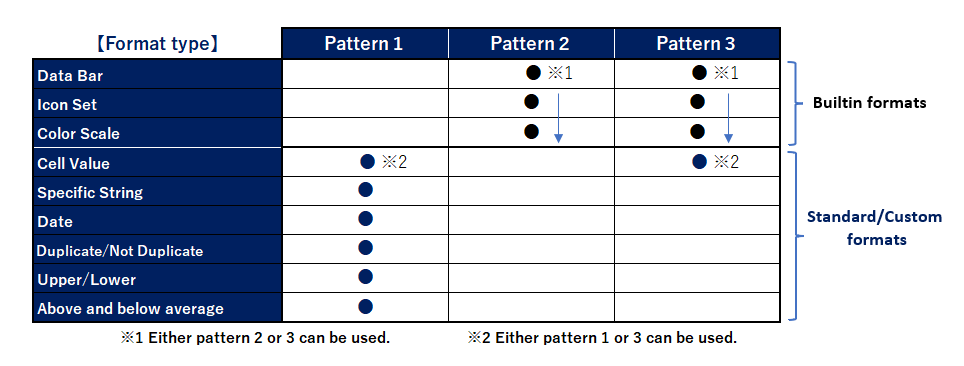
Builtin formats such as data bars have two ways of defining extraction conditions, “Pattern 2” and “Pattern 3,” as shown in Figure 4.Each requires a different class and has a different procedure for creating Rule objects.
Both can do the same things, so it is better to choose the one that is easier to use.
For analysis items classified into Standard/Custom formats, Rule objects are defined in “Pattern 1“.In some exceptional cases, only “cell values” are also provided with the “Pattern 3” procedure (dedicated class).
From the next section, we will explain how to handle each class (object) concretely according to the procedure shown in Figure 3.
2. Required Class for “Conditional Formatting”

This section describes the class needed to set “Conditional Formatting”.
To obtain a “Rule object,” there are various classes, depending on the type of format.
2.1 Define Extraction Condition(Format Object)
Pattern2 requires an object called “FormatObject” that manages data attributes (values, type names, and bounds).This attribute information is used to set “decision thresholds” for data distribution and visualization.
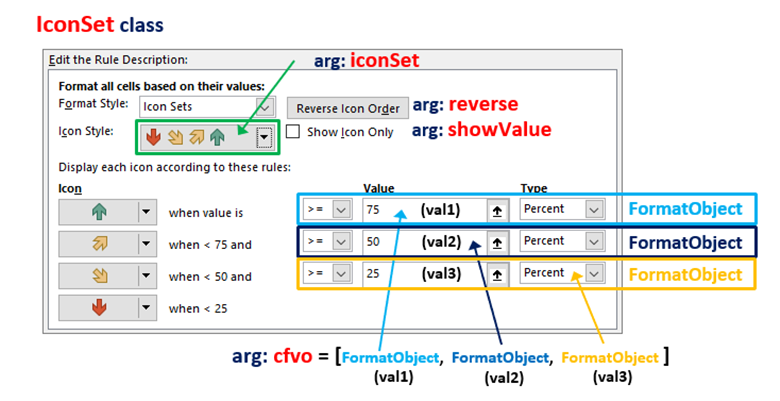
For example, Figure 5 below is an excerpt from the “Icon Set” formatting dialog, in which objects of the FormatObject class define thresholds such as “green” if 67% or more, “yellow” if 33% or more, and red otherwise.
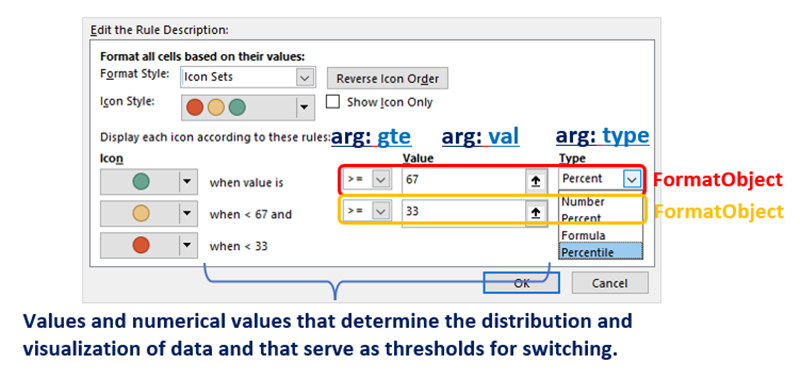
A FormatObject object is defined by specifying the following arguments to the class.Obtains objects for the number of data required for the decision conditions to be extracted.
In the example in Fig5, there may be two or three objects, depending on the type of icon.
from openpyxl.formatting.rule import FormatObject
FormatObject(type, val, gte)
arg: type : Specify the data type of the value (threshold)
arg: val : Specify a value (threshold) (default:None)
arg: gte : Specifies whether to include or exclude values (thresholds) (default:None)
return:FormatObject Object
The setting value for each argument is selected from the following
The arg:type selects the type of data. The arg:val sets the value, but not if min/max is specified for the data type.The arg:gte specifies whether the threshold bounds are included (True) or not included (False).
| Argument | Argument setting options |
|---|---|
| type | Data Type: ‘percent’(%), ‘num’(numerical), ‘min’(mininum), ‘max’(maximum), ‘formula’, ‘percentile’ |
| val | Numeric (integer, float):Not set if min/max is specified for type |
| gte | Threshold Boundaries:True又はNone: ( >= ) / False: ( > ) Not set if min/max is specified for type |
2.2 Define Format Type(Rule Object)
As explained in Section 1.2<Fig.3,4>,the “Rule object” defines the conditional part of “Conditional Formatting”.There were three patterns for obtaining this “Rule object” depending on the format type.
Here, we organize the classes required for each pattern.
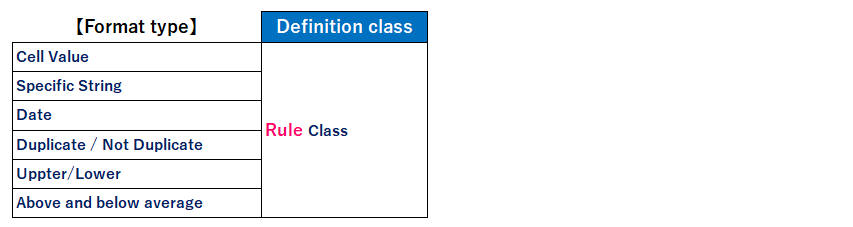
【Pattern1】(Standard/Custom [Specific String/Date/Upper, Lower])
The required information is passed to the argument of the Rule class, and the object is created.(Fig6) The details of argument specification are explained in the next article <Article 6>.
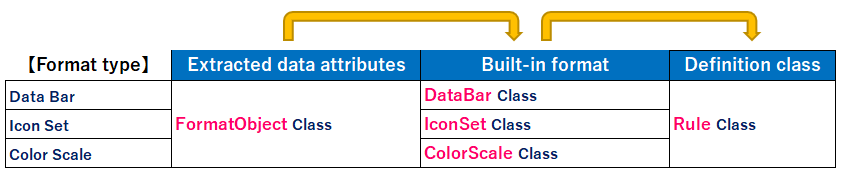
【Pattern2】(Built-in [Data Bar, Icon Set, Color Scale])
Pattern2 is a procedure specific to Built-in format types.Define a Rule object by passing the “built-in format object” for each type, including the “FormatObject (extracted data attribute)” for <Section 2.1>, to the argument of the Rule class.There are three classes of built-in formats. (Fig7)
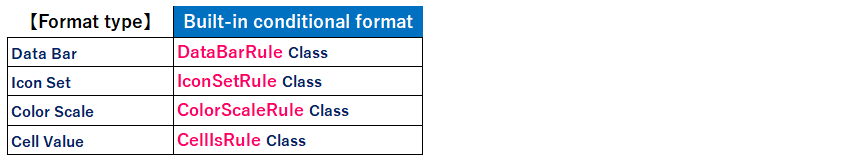
【Pattern3】(Cell Value, Data Bar, Icon Set, Color Scale)
In Pattern 2, three classes (objects) must be combined to obtain a Rule object.This can be said to make the program more complicated.openpyxl also provides a way to simplify the procedure and create a Rule object with only one class.
The supported format types are three Built-in types and “cell values” classified as the Standard/Custom (Fig8)
Both Patterns 2 and 3 can do the same thing. Please choose according to the programmer’s preference.
The details of the various classes required for defining Rule objects are explained in Section3.
2.3 Apply Conditional Format to Cells
Next, the Rule object defined in <Section 2.2> is actually applied to the cell.The “Cell Range” to which conditional formatting is applied is managed per worksheet (Worksheet object).
Of course, you can have more than one in the same sheet, so they are grouped into an iterable object called ConditionalFormattingList.
To apply a Rule object to a cell, use the add() method under the ConditionalFormattingList object in the following format.
Worksheet Object.conditional_formatting property
return: ConditionalFormattingList Object
ConditionalFormattingList Object.add(range_string, cfRule)
arg: range_string : Specify a range of cells to which conditional formatting will be applied
arg: cfRule : Set the Rule object
Specify the target cell range in the arg:range_string as a string, such as ‘A1:C3’.Set the condition definition (Rule object) to the arg:cfRule.
The above is an overview of the classes required to define conditional formatting. The next section will provide concrete examples.
3. Built-in Format(DataBar, IconSet, ColorScale)

<Section 2.2> gave an overview of the class types of “Rule objects” that define extraction conditions. This section introduces concrete class formats and practical examples using sample code.
There are many conditional format types provided by Excel. This article shows examples of the application of “Data Bar” “Icon Set” and “Color Scales” which are classified as “Built-in formats”.
3.1 DataBar
There are two procedures for defining a Rule object for a DataBar. Section 1.2(Fig3, Fig4)
There are two patterns: one is to combine the FormatObject/DataBar/Rule classes, and the other is to define the DataBarRule class by itself.
3.1.1 DataBar by Pattern2
Since the FormatObject object was explained in <Section 2.1>, this section explains the format of the DataBar class.
from openpyxl.formatting.rule import DataBar
DataBar(minLength, maxLength, showValue, cfvo, color)
arg: minLength : Position of the beginning of the bar (left side) (default:None)
(0 for left end, the larger the value, the further to the right it moves)
arg: maxLength : Position of the end of the bar (right side) (default:None)
(100 is the right end, the smaller it is, the more it moves to the left.)
arg: showValue : Display value (default:None)
(False:None (do not display) / True (display))
arg: cfvo : Sets a list whose elements are FormatObject objects. (default:None)
(Values indicating the beginning and end of the data bar (specify two elements))
arg: color : Set bar color(Color Object, ‘FFFFFF’, etc…)
(Currently, only gradation can be specified (single color cannot be specified))
return: DataBar Object
The correspondence between the Excel settings window and each argument is shown in Fig9.
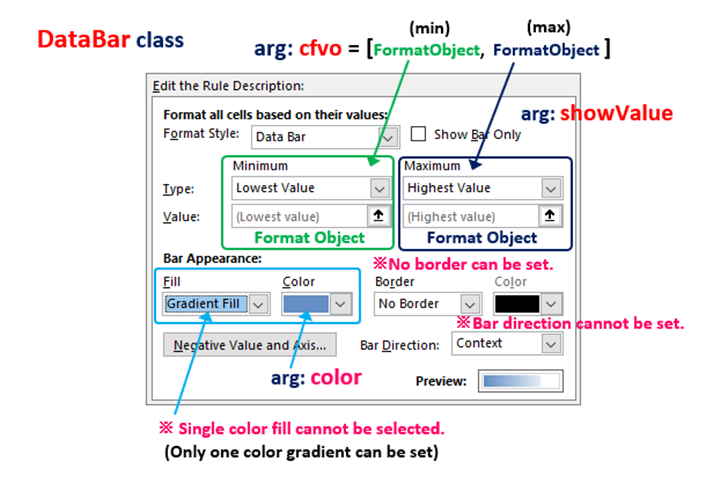
The arg:cfvo is a list of two data attribute information (FormatObject) <Section 2.1>. Other arguments are as in the format.
As a supplementary note, as shown in Figure 9 and the following comments in the official document, there are some restrictions such as “the color of the bar can only be selected as a gradation with white” “the border cannot be set” and “the direction of the bar cannot be set“.
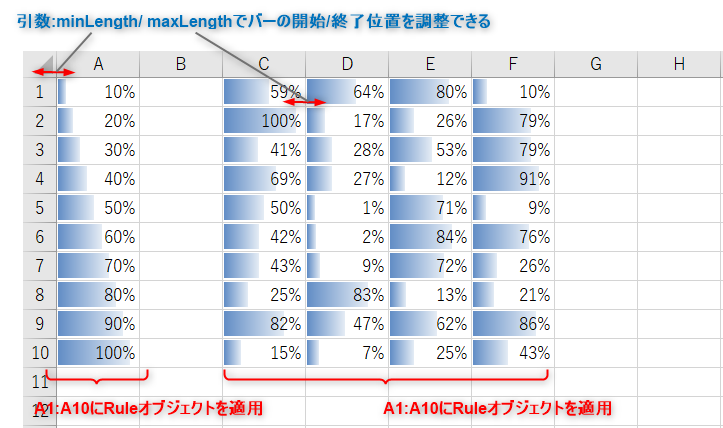
On the other hand, there are some differences from the Excel specification, such as the addition of a setting to adjust the length of the left and right ends of the bar with the arg:minLength/maxLength.
Currently, openpyxl supports the DataBars as defined in the original specification. Borders and directions were added in a later extension.
openpyxl Official Documents (About the format of the data bar)
Next, obtain a Rule object. The object sets the Rule class to the following format.To set the conditional format to ‘DataBar‘ specify the arg:type as ‘dataBar‘.
Then, then DataBar object is set to arg:dataBar.
from openpyxl.formatting.rule import Rule
Rule(type, dataBar)
arg: type : Conditional format type is set to “dataBar“
arg: dataBar : Set the DataBar Object
return: Rule Object
【SAMPLE (1)】
Now, let’s see how to handle these classes (objects) with sample code.
The code summary is as follows: apply a “Data Bar” to numeric data entered in two cell ranges (“A1:A10”, “C1:F10”).The bar should be based on the minimum value of each cell range to the left and the maximum value to the right.
Files (.xlsx) read by this program can be downloaded from
from openpyxl import load_workbook

# Import classes needed for DataBar formatting
from openpyxl.formatting.rule import DataBar, FormatObject
from openpyxl.formatting.rule import Rule

wb = load_workbook('Conditional_Formatting.xlsx')
ws = wb.active


# [A]-----------------------------------------------------------------------------------
# Generating FormatObject and DataBar Objects

# Attribute (type) of the reference data in the Data Bar as min and max value
first = FormatObject(type='min')
second = FormatObject(type='max')

# Generates an object by setting the reference data in list format to the arg:dfvo of the DataBar class.
data_bar = DataBar(cfvo=[first, second], color="638EC6", showValue=None, minLength=None, maxLength=None)

print(type(data_bar))
# >> <class 'openpyxl.formatting.rule.DataBar'>


# [B]-----------------------------------------------------------------------------------
# Generating Rule Objects

# Specify 'dataBar' for the arg:type and a DataBar object for the arg:dataBar.
rule = Rule(type='dataBar', dataBar=data_bar)

# [C]-----------------------------------------------------------------------------------
# Apply conditional formatting (set Rule object)

ws.conditional_formatting.add("A1:A10", rule)
ws.conditional_formatting.add("C1:F10", rule)

wb.save('CF_DataBar_apply_En.xlsx')
Now, let me explain the key points of the code.
By specifying ‘min‘/’max‘ in the arg:type of the Formatobject class, the left end of the bar is set to the “minimum value” and the right end of the bar is set to the “maximum value.
In the case of ‘min’/’max’, the arg:val and arg:gte are omitted.
Define a conditional format in the DataBar class. The arg:cfvo is set to a list whose elements are the “Formatobject object”.
The arg:color specifies the color information of the bar in Hex notation.Other specifications for displaying values and adjusting the length of the bar are omitted. (‘None'[default])
Obtains a Rule object by setting the arg:type of the Rule class to ‘dataBar‘ and specifying the ‘DataBar object’ for the arg:dataBar.
Finally, the add() method of ConditionalFomattingList applies the Rule object to “A1:A10”, “C1:F10”.
The results of the execution are shown in Fig11 that follows.
3.1.2 DataBar by Pattern3
The format for obtaining a Rule object from the DataBarRule class (Pattern 3) is as follows.
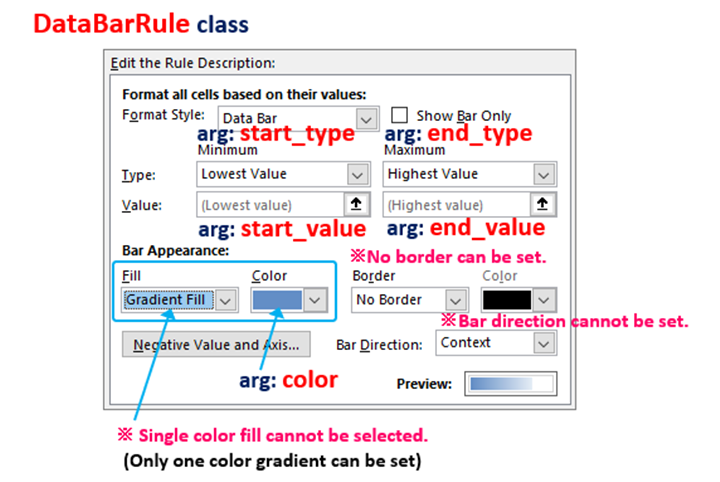
The starting point (left end) information of the bar is specified directly in the arg:start_value, arg:start_type and the ending point (right end) information in the arg:end_value, arg:end_type.
from openpyxl.formatting.rule import DataBarRule
DataBarRule(start_type, start_value, end_type, end_value, color, minLength, maxLength)
arg: start_type : Bar Beginning Value Type (Default:None)
(‘percent’(%), ‘num’, ‘min’, ‘max’, ‘formula’, ‘percentile’)
arg: start_value : Value at the beginning of the bar (Default:None)
(If min/max is specified for type, it is not set.)
arg: end_type : Bar End Value Type (Default:None)
(‘percent’, ‘num’, ‘min’, ‘max’, ‘formula’, ‘percentile’)
arg: end_value : Value at the beginning of the bar (Default:None)
(If min/max is specified for type, it is not set.)
arg: color : Set the bar color (Default:None)
(Color Object, ‘FFFFFF’, etc…)
arg: minLength : Location of the beginning of the bar(left side) (Default:None)
(0 to the left end, the further to the right it moves.)
arg: maxLength : Position of the end of the bar (right side) (Default:None)
(Right end at 100, the further to the left it moves.)
reurn: Rule Object
The correspondence between the Excel settings window and each argument is shown in Fig10.
【SAMPLE (2)】
Let’s check out a real example of the DataBarRule class with sample code.<List2>
The outline of the code is the same as in the previous , with the only difference being the use of the DataBarRule class (Line.14).The code is simplified because the creation of the Rule object can be done in a single line.
Files (.xlsx) read by this program can be downloaded from
from openpyxl import load_workbook

# Import classes needed for DataBar formatting (one class)
from openpyxl.formatting.rule import DataBarRule


wb = load_workbook('Conditional_Formatting.xlsx')
ws = wb.active

# [A]-----------------------------------------------------------------------------------
# Generate Rule(DataBarRule) object

# Specify data attributes (type, value) directly as
# arguments and even generate Rule objects at once
rule = DataBarRule(start_type='min', start_value=None, end_type='max', end_value=None,
                   color="FF638EC6", showValue="None", minLength=None, maxLength=None)

# [B]-----------------------------------------------------------------------------------
# Apply conditional formatting (set Rule object)

ws.conditional_formatting.add("A1:A10", rule)
ws.conditional_formatting.add("C1:F10", rule)

wb.save('CF_DataBar_apply_En.xlsx')
The results of running List1 and List2 are as follows. Data bars based on minimum and maximum values could be applied to each cell.
The results of <List1>/<List2> can be downloaded from
3.2 IconSet
The procedure for creating IconSet Rule object is similar.
There are two patterns: one is to combine FormatObject/ IconSet /Rule classes, and the other is to define the IconSetRule class by itself.
3.2.1 IconSet by Pattern2
IconSet objects are obtained by specifying arguments in the following format.
Setting data attribute(FormatObject) in arg:cfvo is the same as in the previous ”Data Bar”. But the number of objects required(number of elements in the list) depends on the type of icon specified in the arg:iconSet.
For example, ‘3Symbols2’ will prepare FormatObjects for 3 elements, and ‘4ArrowsGray’ will prepare FormatObjects for 4 elements.
from openpyxl.formatting.rule import IconSet
IconSet(iconSet, cfvo, showValue, reverse)
arg: iconSet : Specify icon type (default:None)
(‘3Symbols2’, ‘4ArrowsGray’, ‘4RedToBlack’ , etc)
arg: cfvo: Sets a list with a FormatObject object as an element (Icon gradation)
(If ‘3Symbols2’, for 3 elements If ‘4ArrowsGray’, then for 4 elements)
arg: showValue : Display value(default:None)
(False:None(Do not display) / True(Display))
arg: reverse : Reverse the order of icons (default:None)
(False:None(Do not display) / True(Display))
return: IconSet object
The correspondence between the Excel settings window and each argument is shown in Fig12.
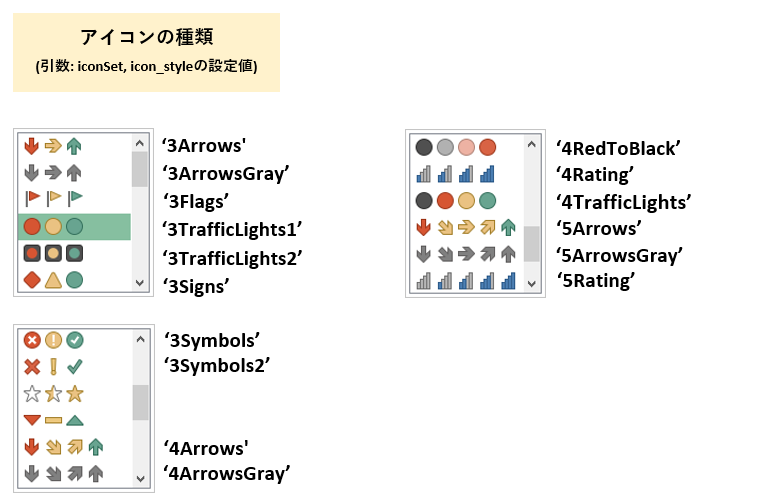
The arg:iconSet sets the icon type.Excel provides the following icons, so specify the default option constants as strings (enclosed in ”).
Next, obtains an object by specifying ”iconSet” in the arg:type of the Rule class. Then, set the arg:iconSet to the “IconSet object” defined earlier.
from openpyxl.formatting.rule import Rule
Rule(type, iconSet)
arg: type : Conditional format type is set to ‘iconSet
arg: iconSet: Set the IconSet object
return: Rule Object
【SAMPLE (3)】
Now, let’s see how to handle these classes (objects) with sample code.<List3>
The code summary is to apply “3TrafficLights1” (signal icon) to a range of cells containing numerical data (percentages).
Files (.xlsx) read by this program can be downloaded from
from openpyxl import load_workbook

# Import classes needed for IconSet formatting
from openpyxl.formatting.rule import IconSet, FormatObject
from openpyxl.formatting.rule import Rule

wb = load_workbook('Conditional_Formatting.xlsx')
ws = wb.active


# [A]-----------------------------------------------------------------------------------
# Generationof FormatObject and IconSet objects

# Attributes (type and value) of the reference data of the icon set as "%" respectively
first = FormatObject(type='percent', val=0)
second = FormatObject(type='percent', val=33)
third = FormatObject(type='percent', val=67)

# Generate an object by setting the icon of a traffic light to the arg:iconSet of the IconSet class
# and setting a list of criteria data in the arg:cfvo.
iconset = IconSet(iconSet='3TrafficLights1', cfvo=[first, second, third], showValue=None, reverse=None)

print(type(iconset))
# Confirmation of type >><class 'openpyxl.formatting.rule.IconSet'>


# [B]-----------------------------------------------------------------------------------
# Generating Rule Objects

# Specify 'iconSet' for the arg:type and IconSet object for the arg:iconSet
rule = Rule(type='iconSet', iconSet=iconset)

print(type(rule))
# Confirmation of type >><class 'openpyxl.formatting.rule.Rule'>


# [C]-----------------------------------------------------------------------------------
# Apply conditional formatting (set Rule object)

ws.conditional_formatting.add("A1:A10", rule)
ws.conditional_formatting.add("C1:F10", rule)

print(type(ws.conditional_formatting))
# Confirmation of type >> <class 'openpyxl.formatting.formatting.ConditionalFormattingList'>

wb.save('CF_IconSet_apply_En.xlsx')
Now, let me explain the key points of the code.
Define the data attribute that serves as the icon switching threshold in the FormatObject class. Three reference values are defined here (data type [%], threshold [0,33,67]).
Define an IconSet object. The arg:iconset is set to “3TrafficLights1” (signal icon) and the arg:cfvo is set to a list of icon switching thresholds (FormatObject object) as elements.
Defines a Rule object.Specify “iconSet” for the arg:type and an IconSet object for the arg:iconSet. Finally, the add() method of ConditionalFomattingList applies the Rule object to “A1:A10”, “C1:F10”.
The results of the execution are shown in Fig15, which follows.
3.2.2 IconSet by Pattern3
The format for retrieving a Rule object from the IconSetRule class (Pattern 3) is as follows.
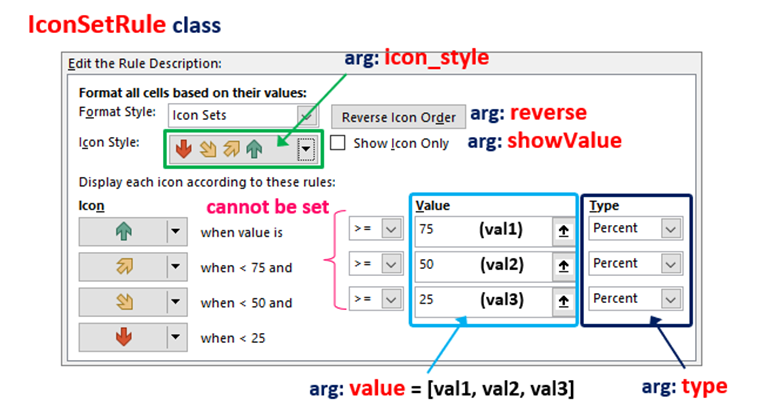
The icon type is specified by a string constant (Figure13) in the arg:icon_style. The type of data is specified in the arg:type and the value is specified in the arg:values for the required number of elements in a list format.
from openpyxl.formatting.rule import IconSetRule
IconSetRule(icon_style, type, values, showValue, reverse)
arg: icon_style : Specify icon type (default:None)
(‘3Symbols2’, ‘4ArrowsGray’, ‘4RedToBlack’ etc)
arg: type : Specify the type of data for the value (threshold) (default:None)
(‘percent’, ‘num’, ‘min’, ‘max’, ‘formula’, ‘percentile’)
arg: values : Set a list with elements (thresholds) Icon Gradation
(If ‘3Symbols2’, for 3 elements If ‘4ArrowsGray’, then for 4 elements)
arg: showValue : Display value (default:None)
(False:None(Do not display) / True(Display))
arg: reverse : Reverse the order of icons (default:None)
(False:None(Not inverted.) / True(Inverse)
return: Rule object
The correspondence between the Excel settings window and each argument is shown in Fig14.
【SAMPLE (4)】
Let’s check out a real example of the IconSetRule class with sample code.<List4>
The outline of the code is almost the same as the previous , with the only difference being the use of the IconSetRule class (line 14).The code is simplified because the creation of the Rule object can be done in a single line.
Files (.xlsx) read by this program can be downloaded from
from openpyxl import load_workbook

# Import classes needed for IconSet formatting (one class)
from openpyxl.formatting.rule import IconSetRule

wb = load_workbook('Conditional_Formatting.xlsx')
ws = wb.active

# [A]-----------------------------------------------------------------------------------
# generation of Rule(IconSetRule) object

# Specify data attributes (type, value) directly as arguments and even generate Rule objects at once
# The type of icon is specified(3-color traffic light)
rule = IconSetRule(icon_style='3TrafficLights1', type='percent', values=[0, 33, 67], showValue=None, reverse=None)

print(type(rule))
# 型の確認 >><class 'openpyxl.formatting.rule.Rule'>


# [B]-----------------------------------------------------------------------------------
# Apply conditional formatting (set Rule object)

ws.conditional_formatting.add("A1:A10", rule)
ws.conditional_formatting.add("C1:F10", rule)

print(type(ws.conditional_formatting))
# >> <class 'openpyxl.formatting.formatting.ConditionalFormattingList'>

wb.save('CF_IconSet_apply_En.xlsx')
The results of running List3 and List4 are as follows: a set of icons was applied with three percentage values (%) as thresholds (0%, 33%, 67%).
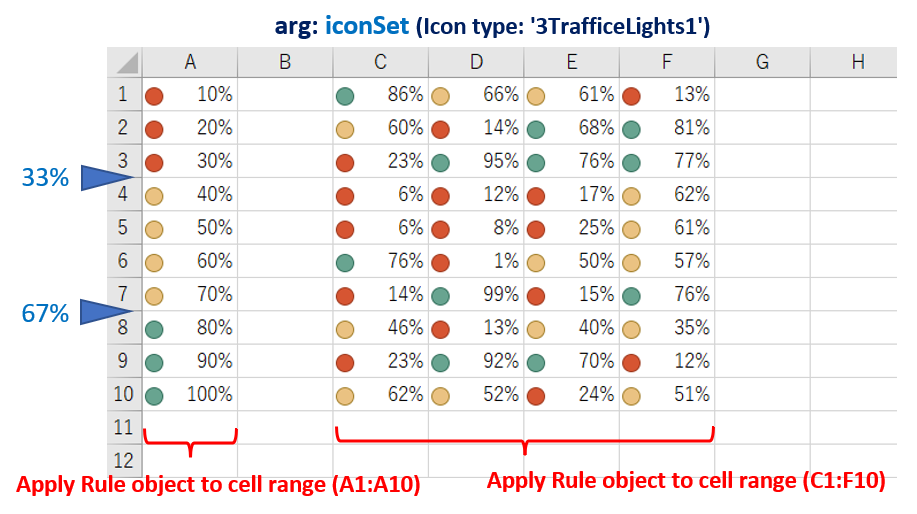
The results of <List3>/<List4> can be downloaded from
3.3 ColorScale
The procedure for creating a Rule object for ColorScale is similar.
There are two patterns: one is to combine FormatObject/ ColorScale /Rule classes, and the other is to define ColorScaleRule class by itself.
3.3.1 ColorScale by Pattern2
The ColorScale object is obtained by specifying arguments as in the following format.
It is the same as before to set the data threshold (FormatObject) in the arg:cfvo.
The arg:color is a list of color information (Color object etc…) to be paired with the FormatObject (2 or 3 elements in the order of starting point, [middle], and end point).
from openpyxl.formatting.rule import ColorScale
ColorScale(cfvo, color)
arg: cfvo : Sets a list whose elements are FormatObject objects.(default:None)
(Values (2 or 3 elements) indicating the start, (midpoint) and end points of the color scale.)
arg: color : Sets a list whose elements are the colors of the scale (Color object, ‘FFFFFFFF’, etc…)
(Values (2 or 3 elements) indicating the start, (midpoint) and end points of the color scale.)
return: ColorScale Object
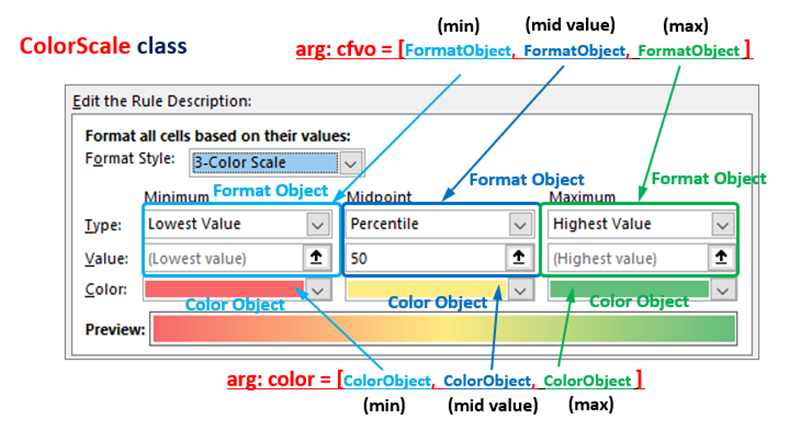
The correspondence between the Excel settings window and each argument is shown in Fig16.
Next, obtain a Rule object. The arg:type of the Rule class should be ‘colorScale‘. And for the arg:colorScale, specify the “ColorScale object”
from openpyxl.formatting.rule import Rule
Rule(type, colorScale)
arg: type : Conditional format type is set to ‘colorScale
arg: colorScale: Set the ColorScale object
retrun: Rule Object
【SAMPLE (5)】
Now, let’s see how each classes is handled in a sample program.<List5>
A summary of the code is as follows
In [A], a FormatObject object is generated to serve as the reference data.
In the example, three reference data are prepared, with “max” (maximum) and “min” (minimum) as the starting and ending point types, and “num” (value) as the middle point. Color information for each data is also prepared accordingly.
The object is obtained by passing the next created FormatObject object and the list of color information to the ColorScale class argument.
Then, in [B], a Rule object is created by specifying ‘colorScale’ in the arg:type of the Rule class and the ColorScale object from [A] in the arg:colorScale.
Finally, [C] applies the defined format(Rule object) to the specified cell range (A1:A10, C1:F10).
from openpyxl import load_workbook
from openpyxl.styles import Color

# Import classes needed for ColorScale formatting
from openpyxl.formatting.rule import ColorScale, FormatObject
from openpyxl.formatting.rule import Rule

wb = load_workbook('Conditional_Formatting_num.xlsx')
ws = wb.active

# [A]-----------------------------------------------------------------------------------
# Generation of FormatObject and ColorScale objects

# Reference data (starting point (min value) and ending point (max value), middle is value) object
first = FormatObject(type='min')
mid = FormatObject(type='num', val=50)
last = FormatObject(type='max')

# Prepare color information (Color object) in list format
# in the order of starting point, intermediate point, and ending point
colors = [Color('FFCC00'), Color('3366FF'), Color('99CC00')]

# Generate objects from ColorScale class with reference
# data and color information as arguments
color_scale = ColorScale(cfvo=[first, mid, last], color=colors)


# [B]-----------------------------------------------------------------------------------
# Generating Rule Objects

# Specify 'colorScale' for the arg:type and a ColorScale object for the arg:colorScale
rule = Rule(type='colorScale', colorScale=color_scale)


# [C]-----------------------------------------------------------------------------------
# Apply conditional formatting (set Rule object)

ws.conditional_formatting.add("A1:A10", rule)
ws.conditional_formatting.add("C1:F10", rule)


wb.save('CF_ColorScale_apply_En.xlsx')
The results of the execution are shown in Fig18, which follows.
3.3.2 ColorScale by Pattern3
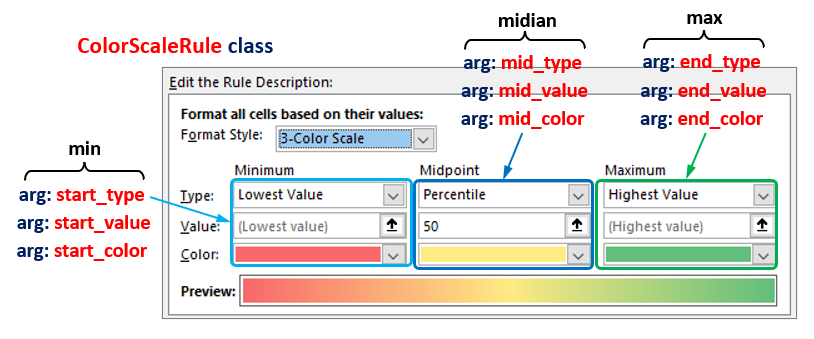
The format for obtaining a Rule object from the ColorScaleRule class is as follows. Generates objects directly by specifying data attributes (value, type, color) in the args:(min_, mid_, max_*)
from openpyxl.formatting.rule import ColorScaleRule
ColorScaleRule(start_type, start_value, start_color, mid_type, mid_value, mid_color, end_type, end_value, end_color)
arg: start_type : Specify the data type of the starting point of the scale
(‘percent’, ‘num’, ‘min’, ‘max’, ‘formula’, ‘percentile’)
arg: start_value : Set the value of the starting point of the scale
(If min/max is specified for type, it is not set.)
arg: start_color : Set the color of the starting point of the scale
(例) Color Object, ‘FFFFFF’)
arg: mid_* : Set the data type, value, and color of the midpoint of the scale
arg: end_* : Set the data type, value, and color of the endpoint of the scale
return: Rule object
The correspondence between the Excel settings window and each argument is shown in Fig17.
【SAMPLE (6)】
Now, let’s check the usage of the classes in a sample program. <List6>
Unlike Pattern 2 in <2.3.1> above, in [A], the ColorScaleRule class alone generates up to a Rule object at a time. The number of arguments increases, but the overall code is cleaner and more coherent.
Files (.xlsx) read by this program can be downloaded from
from openpyxl import load_workbook

# Import classes needed for ColorScale formatting (one class)
from openpyxl.formatting.rule import ColorScaleRule

wb = load_workbook('Conditional_Formatting_num.xlsx')
ws = wb.active

# [A]-----------------------------------------------------------------------------------
# Creation of Rule(ColorScaleRule) object

# Specify data attributes (type, value) and color information directly as arguments
# and generate Rule objects at once
rule = ColorScaleRule(start_type='min', start_value=None, start_color='FFCC00',
                        mid_type='percentile', mid_value=50, mid_color='3366FF',
                        end_type='max', end_value=None, end_color='99CC00')

# [B]-----------------------------------------------------------------------------------
# Apply conditional formatting (set Rule object)

ws.conditional_formatting.add("A1:A10", rule)
ws.conditional_formatting.add("C1:F10", rule)

wb.save('CF_ColorScale_apply_En.xlsx')
The results of the execution of List5 and List6 are as follows. The “Color Scale” that changes color by three criteria (maximum, 50, minimum) could be applied to the target cell range.
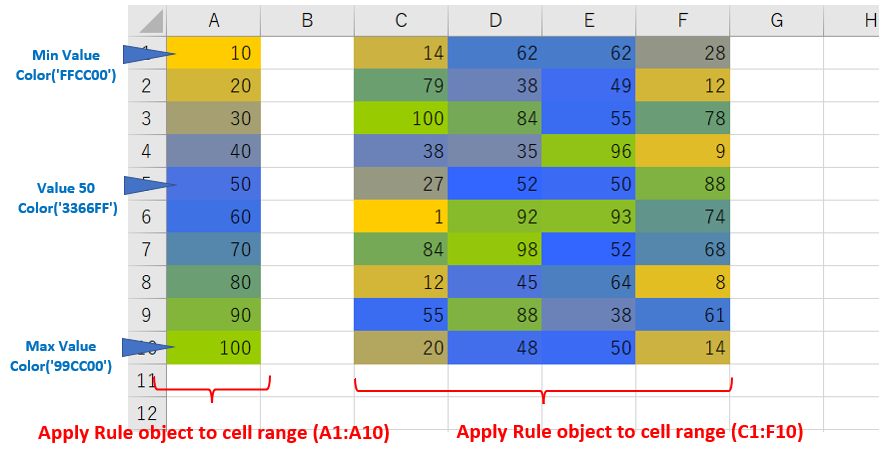
The results of <List5>/<List6> can be downloaded from
4. Summary

How was it?
We have described how to use the external library “openpyxl” to manipulate Excel and set conditional formatting on cells.
Python” and “Excel” are both good at data analysis, so they are an excellent match. Many of you are familiar with Excel analysis tools, and there is a wealth of related information available.
Instead of using Python for all data processing, we can integrate it well with Excel and say, “This process and this function is done in Excel! Data visualization is in Excel!” It may be a good idea to be able to use them in different ways.
I hope this “openpyxl” will be the bridge between the two.
Let me summarize the main points of this article.
1. To set conditional formatting, define the conditions such as “what and how” as a Rule object.
2. There are three patterns in the procedure for generating a Rule object, depending on the type of conditional form desired.
–Type1:Obtain an object by specifying the extraction conditions directly in the “Rule class” argument
–Type2:Combining an object of the built-in condition formatting class with the Rule class
–Type3:Hybrid of Pattern 1 and 2
3. Each of the built-in formats (data bar, icon set, and color scale) has its own dedicated class. In addition, two different classes are used for each format type.
We will continue with the second part of Conditional Formatting in the next issue. We’ll be discussing “cell highlighting rules,” “upper and lower limit rules,” and more, so stay tuned!
Click here for the link.

Thank you for reading to the end.