In this article, we will continue to introduce the “python-pptx” library, which provides functions to operate “PowerPoint” from Python.
Please refer to the following table of contents for the series.
Now, in the previous article, I explained the procedure for creating graphs, but what you may want to consider following graphs is inserting “Table” into slide, right?
Once you have a rough idea of the trend with graphs, it is a good idea to also include the source data. This increases the credibility and accuracy of the data and makes it easier to convey to others.
Tables are also a function in which ”Excel” excels. I think that the most common procedure is to create a “Presentation” by pasting the table created in Excel onto slides.
Also, there may be some routine tasks, such as monthly sales reports, where the template for the presentation has been prepared to some extent, and the numbers in the table are to be replaced. In such cases, it would be faster and easier to automate the process by operating PowerPoin directly without going through Excel.
In this fourth article in the series, we will show you how to create tables using only PowerPoint with “python-pptx”.
By reading this article you will learn the following.
The usage of various classes and functions introduced in this article is just an example. Please refer to the “Official Documentation” below for details and clarifications.
python-pptx Official Documents(API Document)
https://openpyxl.readthedocs.io/en/stable/
1. Putting a Table(Table object) on the slide

This section outlines the procedure for inserting a table into a slide, provides an overview of the Table object, and describes its related attributes.
1.1 Relationship between slide components and tables
As shown in Fig1, PowerPoint is composed of various elements such as Place folders(TITLE, BODY, etc.), Shapes, Graphs, and Tables.
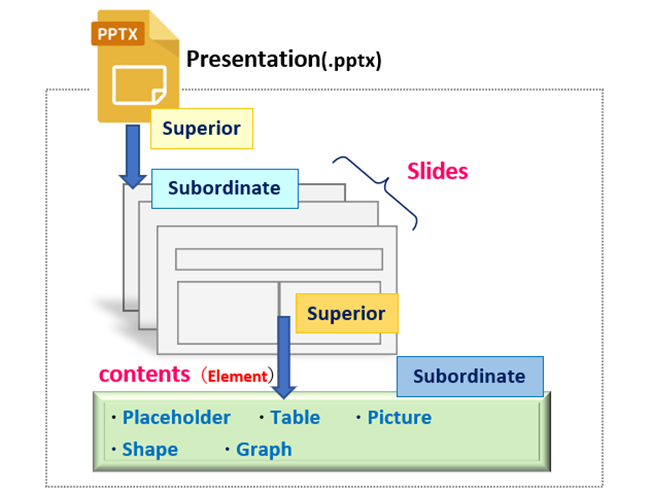
Each of these elements is managed as the Shape object in “python-pptx”. Tables, the main topic of this article, are also treated as a type of Shape object. (Fig2)
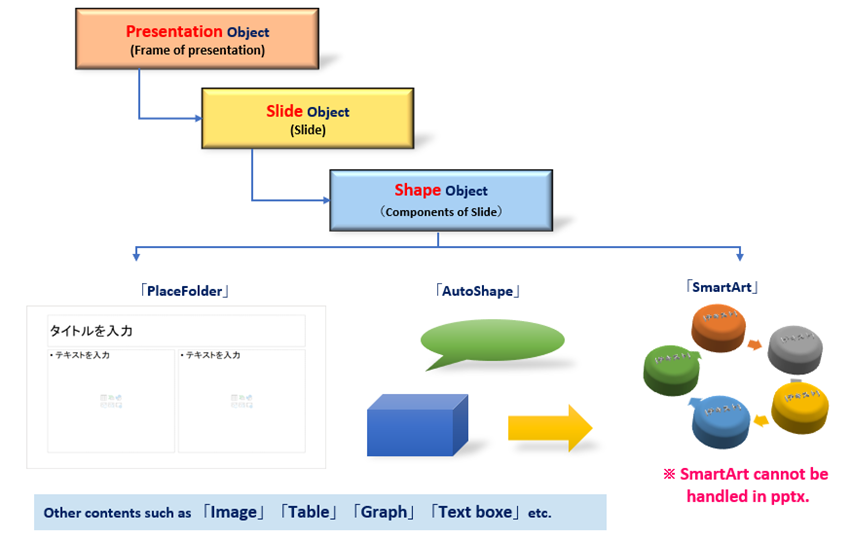
The following section describes the objects, methods, and properties related to the “Shape object” of “Table”.
1.2 Add Shape object for the Table
This section outlines the procedure for inserting tables into slides with “python-pptx”.
The procedure for inserting a table is shown in Fig3. (The numbers ➀~➂ in the following explanation correspond to the numbers in Fig3.)
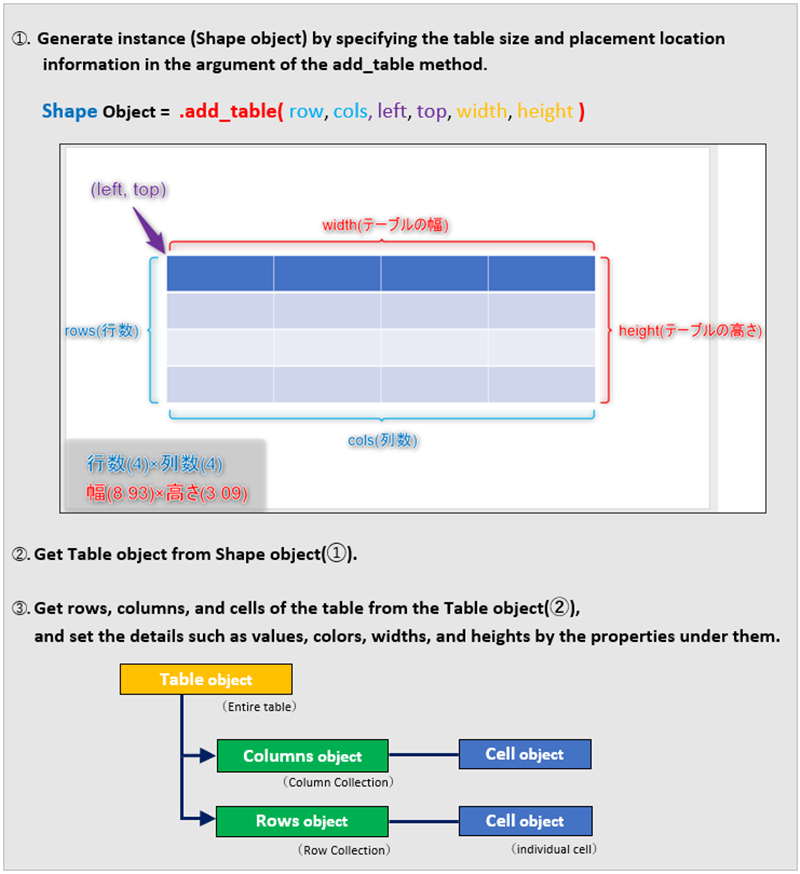
➀ Obtains a Shape object (table) by specifying the size and placement position of the table in the argument of the add_table() method. Next(➁), the Table object is obtained from the Shape object using the table property.
In fact, the entity of the Shape object obtained in ➀ is called the GraphicFrame object, which is a container that manages graphs, tables, and SmartArt. Therefore, in ②, a Table object is further acquired and a table is created with the attributes under it.
This Table object can be further broken down into rows, columns, and cell units (Columns, Rows, and Cells objects, respectively). Each of these will allow you to set cell values, colors, widths, heights, and other details with the various methods and properties under them. ➂
In addition, we’ll also take a deeper look at the Columns, Rows, and Cells objects.
Fig4 shows an image of the various object configurations. (The numbers ➀~➅ in the following explanations correspond to the numbers in Fig4.)
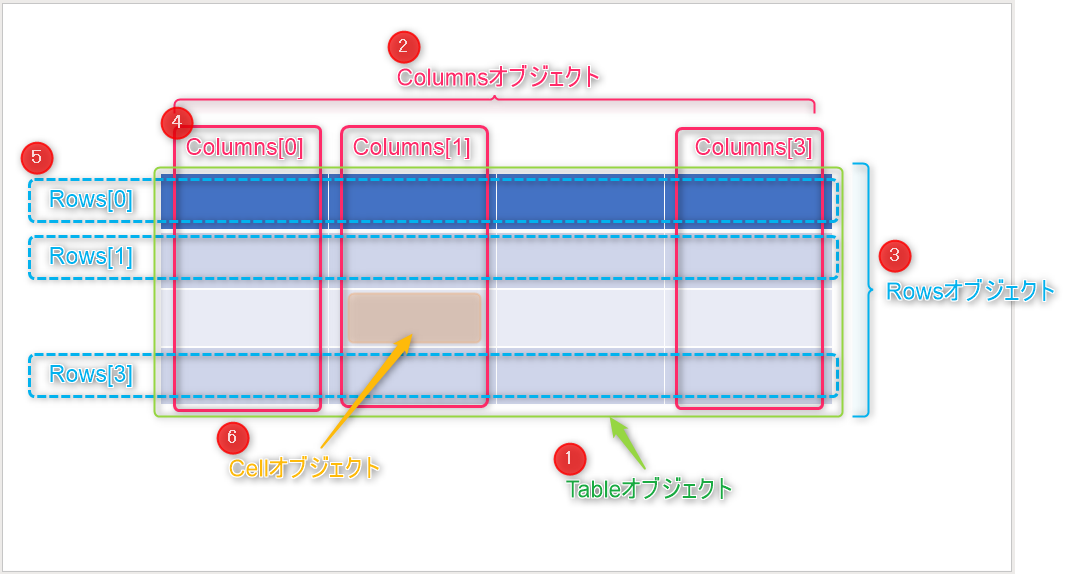
The entire table (➀) is the Table object. The next layer is the Columns object (➁) and the Rows object (➂). Each will be an iterable object with elements for column and row.
Coloumns/Rows objects can access each Row and Column either sequentially or individually via the For statement or Index notation (➃➄). (Note that “s” is not added.)
Also, each individual cell is the Cell object, which is the smallest unit that makes up a table, row, or column. (➅)
In other words, the Column or Row object, and thus the Table object, is an aggregate of Cell objects. (Fig.5)
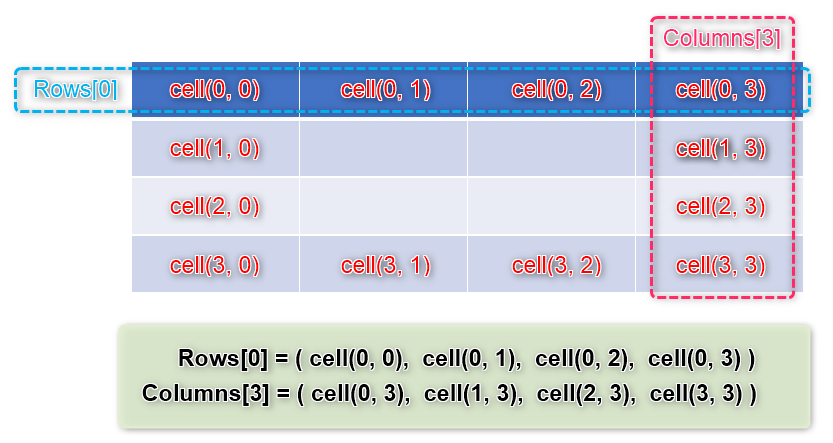
Each Cell object is assigned an index, and each cell is accessed with the reference cell “A1” as “(0, 0)”.
In the following sections, we will discuss each object in depth and at the same time explain the methods and properties associated with it.
1.3 Objects composing the Table
As mentioned earlier, the elements that make up a table have many related objects and properties, including the Shape object. In this section, we will pick up and organize essential objects and their properties.
1.3.1 Add “Table” to the Shapes collection
When adding a new table, The Shape object for the table must be added (and retrieved at the same time). In python-pptx, the add_table() method is supported in the following format.
Shapes Collection.add_table(rows, cols, left, top, width, height )
arg: rows: Set the number of rows in the table to be added
arg: cols: Set the number of columns in the table to be added
arg: left: X position in upper left corner of table
arg: top: Y position in upper left corner of table
arg: width: Width of table
arg: height: Table height
return: The Shape object / Add it to Shapes collection
1.3.2 Get Table object
As mentioned in , the entity of the Shape object added by the add_table() method is the GraphicFrame object, which is a container that manages graphs, tables, and SmartArt.
Therefore, to manipulate the table, it is necessary to extract the Table object from the GraphicFrame object. The following table property is the attribute for this purpose.
Shape Object.table property
return: Table Object
1.3.3 Get Column/Row object
Rows/Columns object manage tables by rows and columns.
These are iterable objects (collections) of all the rows or columns that make up a table.
Access the desired row or column object (Row/Column (note that there is no “s“)) by specifying the index as in the following format.
Table Object.columns[index] property
arg:[index]:Get a specific Column object , The first Column is set to “0”
(If omitted, get a collection)
return: Column Object
Table Object.rows[index] property
arg:[index]:Get a specific Row object , The first row is set to “0”
(If omitted, get a collection)
return: Row Object
The Column object has width property that sets the column width, and the Row object has height property that sets the row height.
Row/Column can also iterably access the constituent Cell objects.
1.3.4 Get and Set Cell Object
The minimum unit that constitutes a table is a Cell object. Several methods are provided for acquiring it.
Table Object.iter_cells()
return: Cell Object
(get the cell in the table in order from the top left cell to the bottom right cell)
Table Object.cell(row_idx, col_idx)
arg: row_idx: Number of table row. (First row is specified by “0”)
arg: col_idx: Number of table column. (First column is specified by “0”)
return: Cell Object
Row Object[index]
arg:index: Specifies the offset from the first row
Coloumn Object[index]
arg:index: Specifies the offset from the top of the column
return: Cell Object
Cell objects have a variety of properties that can be configured in detail. Some of the major ones include.
| 【Cell Object.】 | 【Function Description】 |
|---|---|
| text property | Set a value in cell |
| fill property | Get the【FillFormat Object】 Apply various fill effects with FillFormat object |
| text_frame property | Get the【TextFrame Object】 TextFrame object allows setting paragraphs, characters, and formatting |
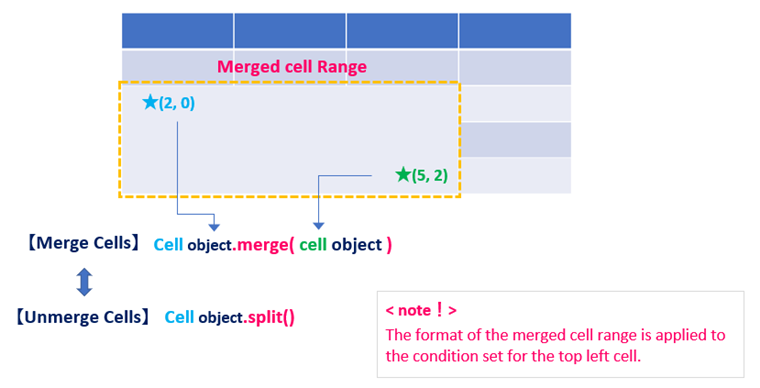
| merge(other_cell) | Merge multiple cells arg:other_cel: Specify the range of cells to be merged (diagonal cells only) |
| split() | Release merged cell “ValueError” occurs when executing on unjoined cells |
| vertical_anchor property | Specify vertical alignment 【MSO_VERTICAL_ANCHOR】TOP, MIDDLE, BOTTOM |
Cell objects can be set to “number” and “string” (text property), but not “image” and “shape”. A paragraph (text_frame property) can also be provided.
It is also possible to combine (merge) multiple cells into one. The merge() method is used for merging, and the split() method is used for unmerging, with the following arguments.
The above is a description of the objects and their attributes related to table creation.
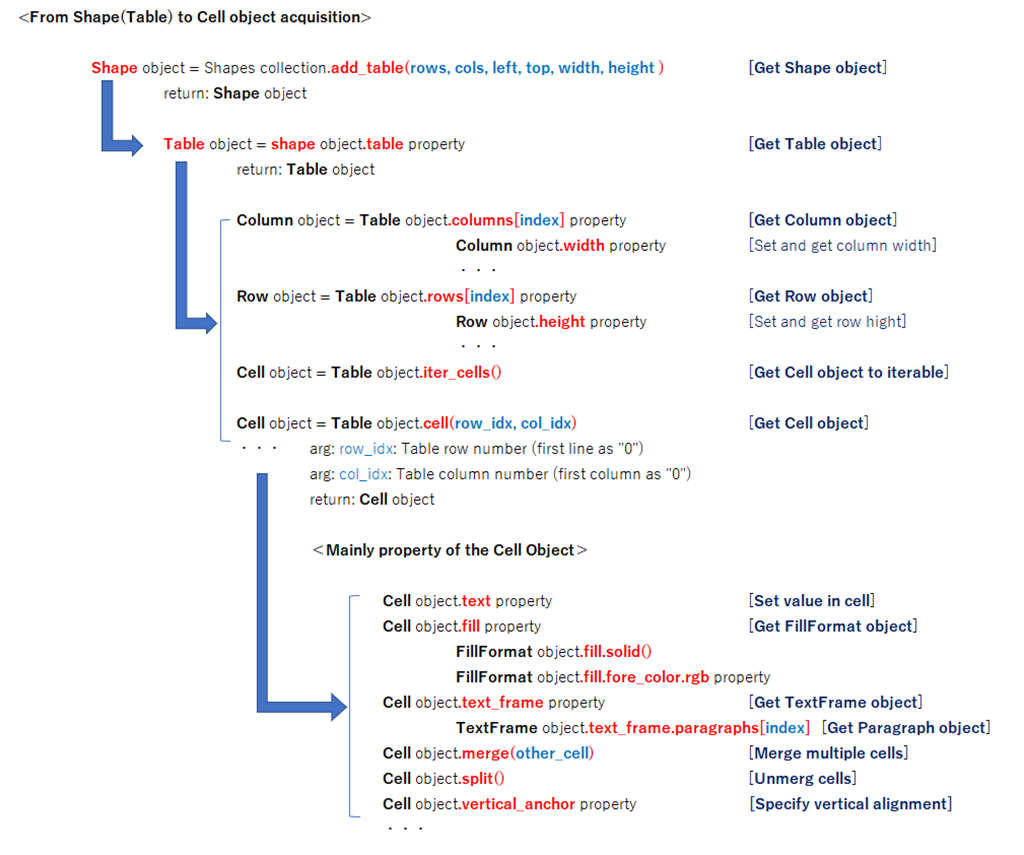
Finally, the object hierarchy is summarized in Fig6.
2. Example of inserting “Table”

So far, we have discussed objects and attributes related to table creation. Let’s check how they are used in practice with examples.
2.1 Sample1 (Basic of Table Creation)
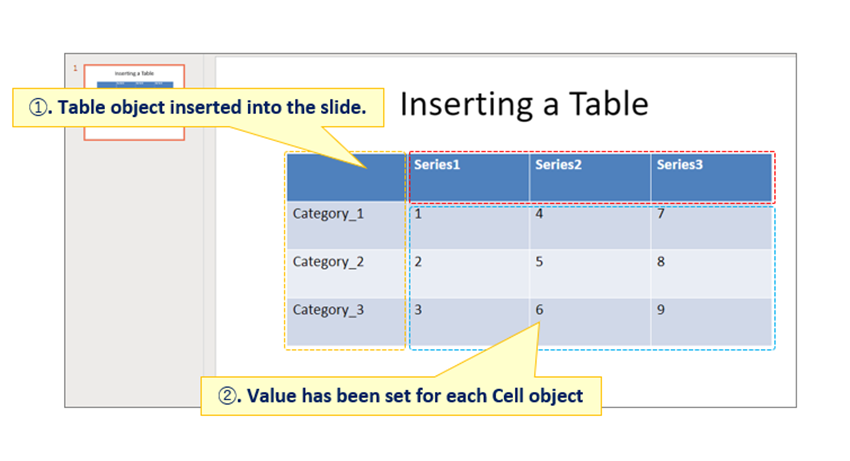
First, here is an example of inserting a table with 4 rows x 4 columns and setting values in each cell.
from pptx import Presentation
from pptx.util import Cm

prs = Presentation()
sld0 = prs.slides.add_slide(prs.slide_layouts[5])
sld0.shapes[0].text = 'Inserting a Table'

rows = 4		# number of rows in table
cols = 4		# number of columns in table

# Add Shape object (table)
# Arguments: number of rows, number of columns, x-coordinate of top-left corner, x-coordinate of top-left corner, width,  height
table_shape = sld0.shapes.add_table(rows, cols,
                                   Cm(3), Cm(5), Cm(20), Cm(8))

table = table_shape.table	# Create Table object

#----------------------------------------------------------------------------
# Column Heading Text Settings

category = ['Category_1', 'Category_2',  'Category_3']

for i in range(len(category)):
    cell = table.cell(i+1, 0)	 # Getting a Cell object
    cell.text = category[i]	   # Set the value with the text property

#----------------------------------------------------------------------------
# Line heading text setting

series = ['Series1', 'Series2', 'Series3']

for i in range(len(series)):
    cell = table.cell(0, i+1)	 # Getting a cell object
    cell.text = series[i]	     # Set the value with the text property

#----------------------------------------------------------------------------
# Set values in other cells

value1 = [[1, 2, 3],[4, 5, 6],[7, 8, 9]]

for i in range(len(value1)):
    for k in range(len(value1[i])):
        cell = table.cell(k+1, i+1)	   # Getting a cell object
        cell.text = str(value1[i][k])	 # Set the value with the text property

prs.save('Art4_List1_result.pptx')
The following is an explanation of key points.
First, add the Shape object (GraphicFrame object) by specifying the table scale (4 rows x 4 columns), position and size in the argument of the add_table() method.
In addition, the table object is obtained by continuing with the table property.
From now on, attributes will be set for this Table object, which will be stored in the ”variable table”.
Set the value in each cell. In the sample, values are set in three “For statement loops” such as “column heading,” “row heading,” and “other” cells.
In the following example of “column heading,” the cell object is accessed by specifying the cell index (the offset from the “A1” cell) as the argument of the cell() method on line 24. After that, set the value of the cell with the text property.
In this case, the contents prepared in the list are accessed sequentially.
The caveat in working with cells is that setting a value must be done for each individual cell. It is not possible to set values in multiple cell ranges at once as in Excel VBA.
(Lines 41~44 also set the value for each individual cell in a double For loop.)
The result of running <List1> is as follows.
The table could be attached to the slide at the specified position and size. Each cell is set to the specified value. (Fig.7)
<List1>Execution results are available here.
2.2 Sample2 (Table Formatting)
Here is one more code example.
The code summary is as follows:
- Reads the presentation saved in <List1> and adjusts the appearance and formatting of the table.
- Specifically, edit the font (Font, Text color, and Centering) and edit the cells format (Fill).
from pptx import Presentation
from pptx.dml.color import RGBColor
from pptx.enum.text import PP_ALIGN  # Class for text frame positioning
from pptx.util import Pt             # Class for specifying points


prs = Presentation('Art4_List1_result.pptx')  # Load an existing file
table = prs.slides[0].shapes[1].table    # Get Table object

#-------------------------------------------------------------------------------------
for col_obj in table.columns:
    print(col_obj)       # <pptx.table._Column object at 0x0000021B8A7FC588>

for row_obj in table.rows:
    print(row_obj)	     # <pptx.table._Row object at 0x0000021B8A7FC588>


#--------------------------------------------------------------------------------------
# Column Heading Format
for i in range(len(table.columns)):	        # Getting the number of table columns
    cell = table.cell(0, i)
    pg = cell.text_frame.paragraphs[0]	    # Getting paragraph object
    pg.font.size = Pt(15)		                # Setting the font size of paragraphs
    pg.font.color.rgb = RGBColor(255, 0, 0) # Setting the font color for paragraphs
    pg.aligment = PP_ALIGN.CENTER	          # Setting paragraph string positioning (centered)

#---------------------------------------------------------------------------------------
# Row Heading Format
for i in range(len(table.rows)):   # Getting the number of table rows
    cell = table.cell(i, 0)
    cell.fill.solid()			         # fill a cell
    cell.fill.fore_color.rgb = RGBColor(100, 200, 50)   # Specify cell fill color

prs.save('Art4_List2_result.pptx')
The following is an explanation of key points.
In line 22, a paragraph is obtained from the Cell object via the text_frame and paragraph properties.
Next, in lines 23 and 24, connect the font property to specify the formatting (font size and color) for each paragraph. In addition, the alignment property on line 25 specifies centered alignment in the cell.
The fill property applies “Fill” effect to the cell. Several fill types are provided as FillFormat object, but this time we will fill with a single color. (solid() method)
Set the RGBColor object to the fore_color.rgb property, which means the foreground color of the cell is specified in RGB.
The result of running <List2> is as follows.
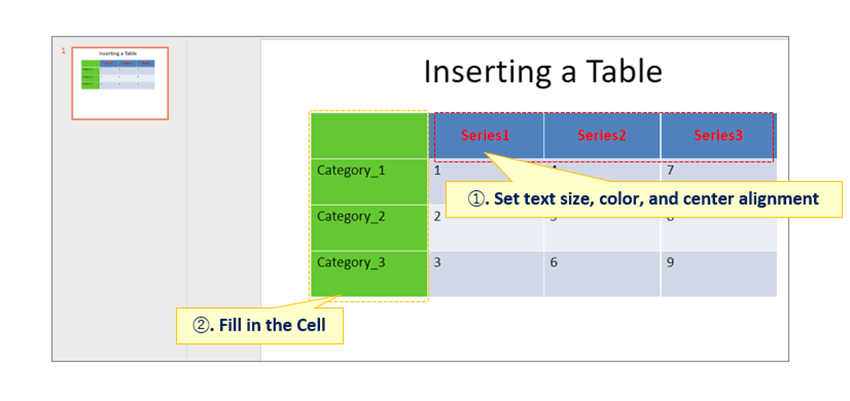
Font size, color, and alignment (centered) could be specified for “Row Heading Titles” and a fill effect could be applied to “Column Heading Titles”. (Fig8)
<List2>Execution results are available here.
3. SUMMARY

How was it?
In this article, we have explained the procedure for inserting tables using the “python-pptx” library.
The combination of graphs (general trends and future projections) introduced in the previous article and tables (specificity) will result in high-quality, easy-to-understand presentation for a third party.
We hope you will make use of the techniques.
Finally, let us summarize the contents of this article so far.
➀. In Python-pptx, tables are managed by the Table object. Table objects are added with add_table() method.
➁. In addition, the Table object has a hierarchical structure that includes various objects for Column, Row, and Cell information. Cell values are referenced and set through the Cell object.
Now, in the next issue, we will explain how to insert shapes.
Create visually appealing presentation with a good balance of “Shapes“, “Tables“, and “Graphs“.
In this concluding article of this series, we have focused on how to insert shapes into slide.
Please read this as well. The link will be here. ↓

Thank you for reading to the end.