We will continue to introduce the “openpyxl” library to manipulate “Excel” from Python.
In the previous article, we discussed the various methods and properties for adding and retrieving Cell objects. Furthermore, we explained how to “set values and formulas”, “join multiple cells”, and “named cell range”.
All Excel work is based on operations on cells (Cell objects). Please refer to the following related articles.

Now you can set and retrieve values such as numbers and strings in cells. However, a monotonous list of data tends to make the content tasteless and lonely.
Therefore, the next thing to consider is to make the formatting of the cells presentable and well organized. It is important to create documents that are intuitive and easy to understand for third parties.
So, the third in a series of articles, we will be adding decorations such as fonts, fills, and borders to the cells. In other words, we will cover how to “Format Setting(style)” to cells.
Openpyxl, of course, has a wealth of modules and classes for cell formatting that can be easily adapted.
However, since there are a wide variety of cell formatting items, the article will be divided into two parts.
In this article, the first part of the series, we will discuss the properties for formatting cells and the various objects that manage “Fonts” “Fills” and “Borders”.
In the next part of the series, we will cover cell “alignment” and “display format” and how users can customize their own styles by combining various objects (“named style definitions“).
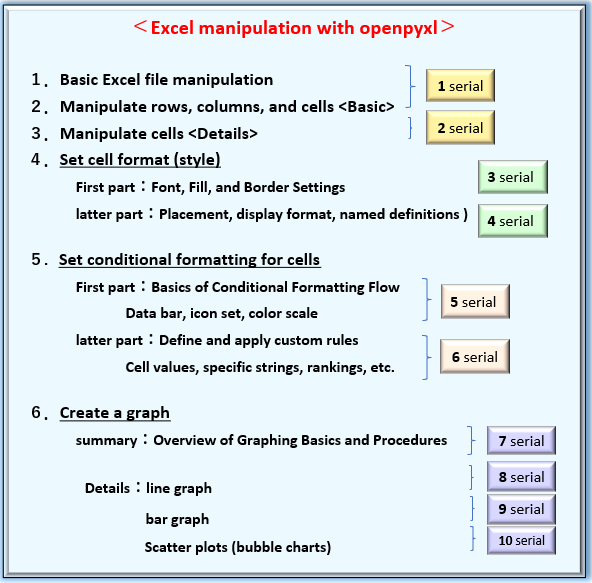
Other overall contents of this series [Python x Excel] are shown here for your reference.
Please stay with us until the end of this article, as you will be able to “do and understand” the following
The information presented on this site is only an example. Please refer to the official website for details and clarifications, if necessary.
【Official Site】:https://openpyxl.readthedocs.io/en/stable/
The next section will explain in detail how to define objects related to formatting Cells.
1. Set Format(Style) of Cell

This section explains how to set fonts and other formatting for individual cells (Cell objects).
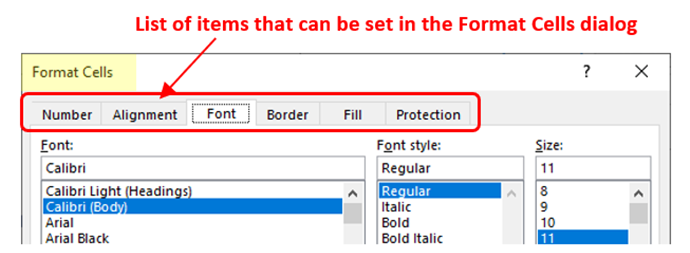
Almost all items in Excel’s Format Cells dialog (Fig.2) can be supported.
<cells formatting>
・Display format, Layout, Font, Bordered line, Fill, Protection
Each format has its own object (class).Formatting (style) is applied to the target cell by setting the object . (Fig.3)
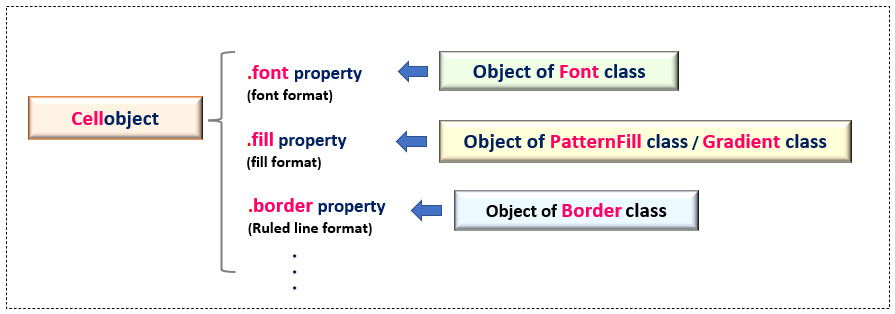
From here on, we will discuss “arguments” and “optional constants” to be specified when creating objects (constructors) from each class.
1.1 Font (Font object) settings
Font settings (font type, size, color, etc.) are defined and managed in the Font object created from the Font class.This can be applied by setting the font property of the Cell object. There are various arguments, but the main ones are listed below.
from openpyxl.styles import Font
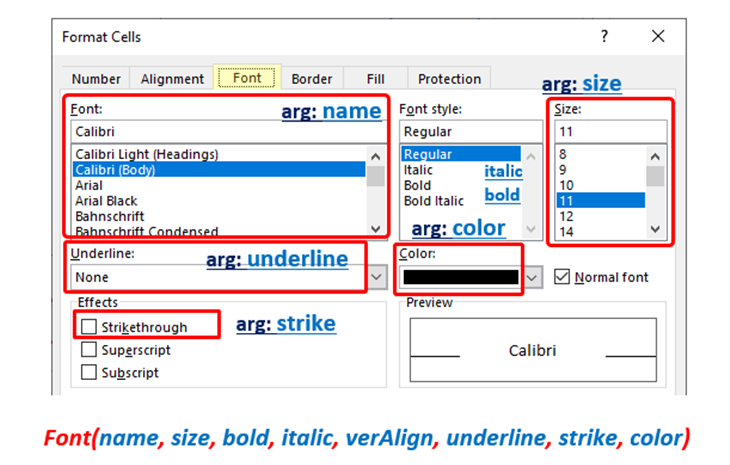
Font(name, size, bold, italic, vertAlign, underline, strike, color)
arg: name : Set the font name(Default: ‘Calibri‘)
arg: size : Set the font size(Default: 11)
arg: bold : make bold(Default: False)
arg: italic : Set italic text(Default: False)
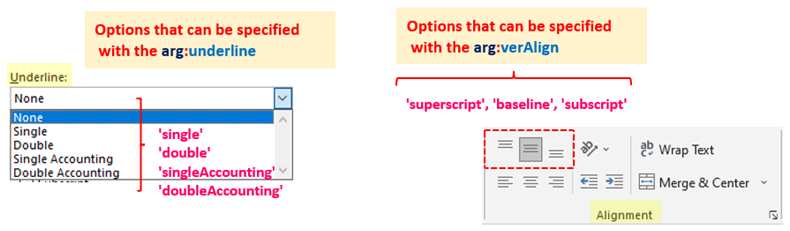
arg: vertAlign : character position(Default: None) Select from ‘subscript’, ‘baseline’, ‘superscript’
arg: underline : Draw an underline(Default: None) Select from ‘singleAccounting’, ‘double’, ‘doubleAccounting’, ‘single’
arg: strike : Draw a negative line(Default: False)
arg: color : Set text color(Default: ‘FF000000‘)
return: Font object
※All arguments are optional
Most of the items that can be set in the cell formatting window (Font Tab) are covered.
Fig.4 contrasts which UI item each argument corresponds to.
Supplementary information on class arguments.
The arg:name is a string containing the name of a stylized font containing Japanese characters such as ‘ Meiryo UI’, ‘ MS Gothic’, etc. Font names may contain spaces, but must be specified with one-byte spaces.
The arg:vertAlign (character alignment (vertical)) and arg:underline (underline) are taken from the default options (Enum) as shown in Fig5.
The text color information is set by the arg:color.There are two ways to specify the values. One is the “α-RGB method,” in which transparency, red, blue, and green information is passed as a string in Hex (hexadecimal) notation (Red is “00FF0000”, Brightness is ’00’ only).
And the second is to set the object to be retrieved from the Color class.
openpyxl has default color information built in, allowing you to choose an “index” or “theme color“. For the index, please also refer to the official documentation below.
However, since it depends on the application, the official website recommends using the “α-RGB method”.
List of index designations for Color class
https://openpyxl.readthedocs.io/en/stable/styles.html#colours
【Sample (1)】
An example code to apply a font format (Font object) to a cell is shown in .
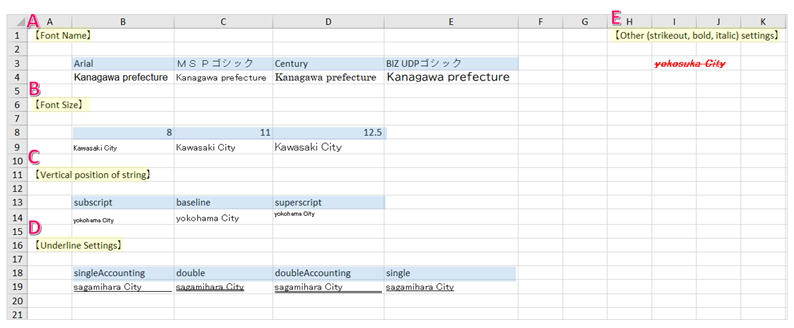
The outline of the code is to “set the font (style)” (A※), “set the font size” (B), “set the position of the text” (C), “set the underline” (D), and “set the strikeout, bold, and italic type” (E) for each cell.
※Symbols such as (A) correspond to comments in the code.
from openpyxl import Workbook
from openpyxl.styles import Font   # Import Font Class

wb = Workbook()
ws = wb.active

#(A)---------------------------------------------------------------------------------------
# Font name (type) setting

ws["A1"].value = '【Font Name】'
range = ws["B3":"E4"]

# Specify Font name's settings「Arial,MS Pゴシック,Century,BIZ UDPゴシック」
font_name = ['Arial', 'MS Pゴシック', 'Century', 'BIZ UDPゴシック']

for cell_1, cell_2, name in zip(range[0], range[1], font_name):
    cell_1.value = name            # Set a value (option constant) in a cell
    cell_2.value = 'Kanagawa prefecture'      # Set value in cell
    cell_2.font = Font(name=name)  # Apply Font object (font name (type))


#(B)---------------------------------------------------------------------------------------
# Font size setting

ws["A6"].value = '【】'
range = ws["B8":"D9"]

# Font size setting value "8, 11, 12.5 points
font_size = [8, 11, 12.5]

for cell_1, cell_2, size in zip(range[0], range[1], font_size):
    cell_1.value = size
    cell_2.value = 'Kawasaki City'
    cell_2.font = Font(size=size)  # Apply Font object (font size)


#(C)---------------------------------------------------------------------------------------
# Set character alignment (vertical)

ws["A11"].value = '【Vertical position of string】'
range = ws["B13":"D14"]

# Specify "subscript", "center", and "superscript" for the position of characters.
font_vertAlign = ['subscript', 'baseline', 'superscript']

for cell_1, cell_2, align in zip(range[0], range[1], font_vertAlign):
    cell_1.value = align
    cell_2.value = 'yokohama City'
    cell_2.font = Font(vertAlign=align)  # Apply Font object (placement position "height")


#(D)---------------------------------------------------------------------------------------
# Set underlines

ws["A16"].value = '【Underline Settings】'
range = ws["B18":"E19"]

# Underline setting value "single, double..." is specified.
font_underline = ['singleAccounting', 'double', 'doubleAccounting', 'single']

for cell_1, cell_2, line in zip(range[0], range[1], font_underline):
    cell_1.value = line
    cell_2.value = 'sagamihara City'
    cell_2.font = Font(underline=line)  # Apply Font object (underline)


#(E)---------------------------------------------------------------------------------------
# Other settings (strikeout, bold, italics)

ws["H1"].value = '【Other (strikeout, bold, italic) settings】'
ws["I3"].value = 'yokosuka City'

# Create a Font object that enables underlining, bolding, and italicizing,
# and changes the text color, and apply it to the cell.
ws["I3"].font = Font(size=12, strike=True, bold=True, italic=True, color='FF0F0F')


wb.save('styles_Font_En.xlsx')
The result of running is as follows
Please refer to the option constants in (C) and (D) as they have been checked for all patterns.
Execution results (.xlsx file) can be downloaded here.
These are the font-related formatting settings. The next section explains how to apply the fill (shading) effect to cells.
1.2 Fill (Fill object) settings
To apply a color or pattern (hatching) to a cell, define and create an object from the PatternFill or GradientFill class.Then, the fill property of the target Cell object is used to apply them.
The difference between the two classes is that a PatternFill object is applied to fill a cell with a pattern (single color), and a GradientFill object is applied to fill a cell with a gradient of two or more shades of color.The following sections will explain in detail.
1.2.1 Pattern Fill effect (PatternFill)
To apply a pattern to a cell, define and create an object in the PatternFill class with the following formatting arguments
from openpyxl.styles import PatternFill
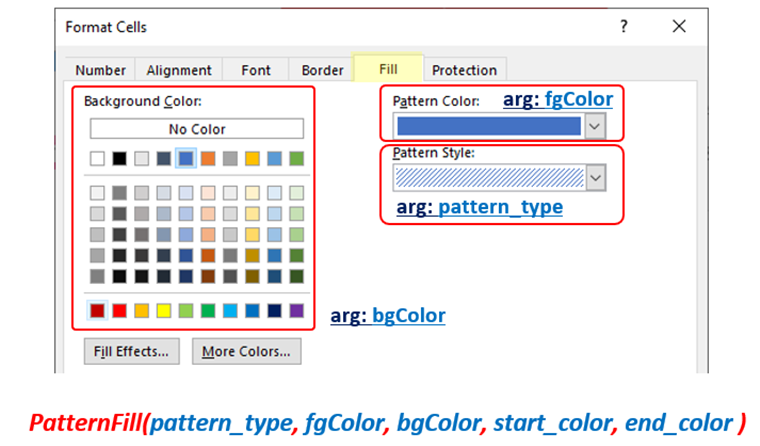
PatternFill(pattern_type, fgColor, bgColor, start_color, end_color)
arg: patternType : Set the fill pattern(default:None) Specify 18 pattern constants
arg: fgColor : Set foreground color
arg: bgColor : Set background color
arg: start_color : Set color 1(default:’00000000‘) Equivalent to setting a foreground color
arg: end_color : Set color 2(default:’00000000) Equivalent to setting the background color
return: PatternFill Object
※All arguments are optional
It covers the items that can be set in the cell formatting window (Fill Tab). Fig.7 shows which UI item each argument corresponds to.
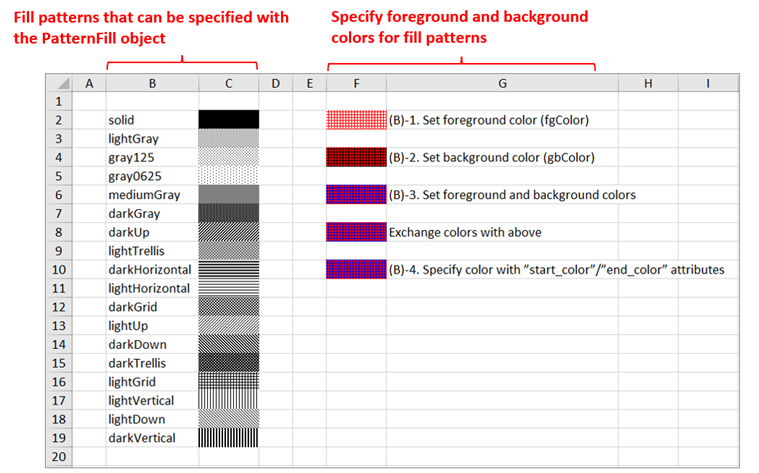
The arg:patternType selects the pattern to fill from the default options (Enum).For example, specify ‘solid‘ for a single-color fill, or ‘gray125‘, ‘darkHorizontal‘, etc. for a pattern with dots or stripes.A total of 18 built-in patterns are available. The sample code below shows examples of how all patterns are applied.
Pattern colors are set separately for foreground and background colors. Set the arg:fgColor and arg:bgColor to α-RGB format or Color object, respectively. (Similar to font formatting)
Foreground and background colors can also be specified with the arg:start_color and arg:end_color. If both are specified at the same time, the latter seems to take precedence.
【Sample Code (2)】
Let’s check a sample code for an example of pattern setting using the PatternFill object.
The code is outlined in (A※) with the arg:patternType to apply and check all 18 built-in patterns.In (B), foreground and background colors are set individually or simultaneously.
The pattern (pattern line) corresponds to the foreground color (fgColor/start_color).
※ Symbols such as (A) correspond to comments in the code.
from openpyxl import Workbook
from openpyxl.styles import PatternFill, GradientFill    # Import PatternFill class

wb = Workbook()
ws = wb.active

# Obtain multiple Cell objects (Range)
range = ws.iter_cols(min_row=2, max_row=20, min_col=2, max_col=3)

# List of optional constants that can be specified for pattern_type
fill_pattern = ['solid', 'lightGray','gray125', 'gray0625', 'mediumGray', 'darkGray',
               'darkUp', 'lightTrellis', 'darkHorizontal', 'lightHorizontal', 'darkGrid',
               'lightUp', 'darkDown', 'darkTrellis', 'lightGrid', 'lightVertical', 'lightDown', 'darkVertical']

# (A)------------------------------------------------------------------------------------------------------------
# Display a list of all patterns

for col in range:
    for cell, pattern in zip(col, fill_pattern): # Unpack with zip function

        if cell.col_idx == 2 :      # If column 'B', print the value of the option constant
            cell.value = pattern
        else:                       # If column 'C', apply fill (pattern)
            cell.fill = PatternFill(patternType=pattern)  # Set the PatternFill object with the fill property

# (B)------------------------------------------------------------------------------------------------------------
# Set foreground and background colors

# (1)Specify foreground color (fgColor)
ws['F2'].fill = PatternFill(patternType='lightGrid', fgColor="FF0000")

# (2)Specify background color (gbColor)
ws['F4'].fill = PatternFill(patternType='lightGrid', bgColor="FF0000")

# (3)Specify foreground and background colors➀
ws['F6'].fill = PatternFill(patternType='lightGrid', fgColor="FF0000", bgColor="0000DD")
ws['F8'].fill = PatternFill(patternType='lightGrid', fgColor="0000DD", bgColor="FF0000")

# Specify foreground and background colors➁
# (4)Color’s can also be specified with start_color/end_color
ws['F10'].fill = PatternFill(patternType='lightGrid', start_color="FF0000", end_color="0000DD")


wb.save('styles_PatternFill_En.xlsx')
The result of running is as follows
The left side (columns B and C) confirms all the built-in patterns. The coloring is monotone, as is the default. Please use this as a reference.
Execution results (.xlsx file) can be downloaded here.
1.2.2 Gradient Fill effect (GradientFill)
To apply two or more gradients to a cell, define and create an object of the GradientFill class with the following format arguments
from openpyxl.styles import GradientFill
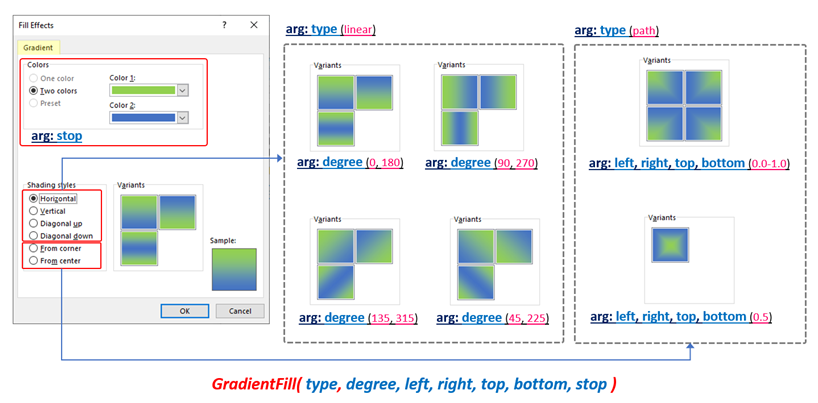
GradientFill(type, degree, left, right, top, bottom, stop)
arg: type : Specify the type of gradation(default:’linear‘) Specify from ‘linear‘(linear change), ‘path‘(rate of change)
arg: degree : Specify the angle of the gradient(default:0) Specify in the range of 0~360(Valid only if type is ‘linear‘)
arg: left : Rate of change in tint on left reference(default:0)
If 20%, specify as ‘0.2( Valid only if type is ‘path’)
arg: right : Rate of change in tint on right reference(default:0)
arg: top : Rate of change in tint on top reference(default:0)
arg: bottom : Rate of change in tint on bottom reference(default:0)
arg: stop : Specify gradient color(default:()) Tuple of 2 or more colors
return: GradientFill Object
※All arguments are optional
This covers all of the items that can be set in the Excel Fill Effects window. Fig.9 shows which UI item each argument corresponds to.
Two patterns of gradients can be specified: one is a “linear change“, in which the color changes at equal intervals toward each opposite side, “top ↔ bottom” and “left ↔ right”.
Another pattern is “Rate of change” which changes the color mixture according to the percentage from the “up, down, left, or right” position.
The former specifies “linear” for the arg:type. The latter specifies “path”.
Color information is given as a tuple in the arg:stop.
Other arguments have different usages depending on which of the arg:type is specified. arg:degree is valid for linear changes, and arg:left/right/top/bottom is valid for rate of changes.
See the following for specific effects.
【Sample Code (3)】
Now, shows an example code to fill a cell with gradient fill.
The following is an overview of the code.
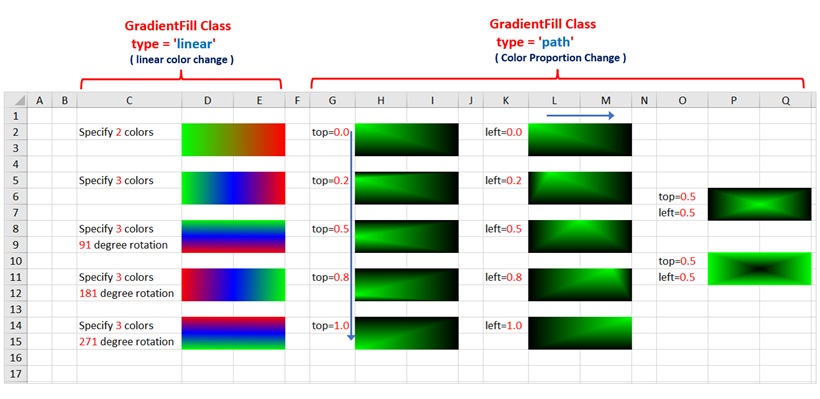
In [A], the arg:type is set to “linear” and the gradation method is set to “linear change.
The color is specified by setting the necessary amount of gradation in a tuple format in the arg:stop. The arg:degree is also specified to change the gradation direction.
In [B], “path” is specified for the arg:type and the gradation method is “rate of change”.
Check the change in gradation while changing the rate of change (0.0~1.0) set for the arg:top/left.
※Symbols such as [A] correspond to comments in the code.
from openpyxl import Workbook
from openpyxl.styles import GradientFill    # Import GradientFill class

wb = Workbook()
ws = wb.active


# (A)--------------------------------------------------------------------------------------------
# Linear Gradient Fill

ws.merge_cells('D2:E3')
# Specify 2 colors
ws['D2'].fill = GradientFill(type='linear', stop=("00FF00", "FF0000"))

ws.merge_cells('D5:E6')
# Specify 3 colors
ws['D5'].fill = GradientFill(type='linear', stop=("00FF00","0000FF", "FF0000"))

ws.merge_cells('D8:E9')
# Specify 3 colors and rotate 91 degrees
ws['D8'].fill = GradientFill(type='linear', stop=("00FF00","0000FF", "FF0000"), degree=91)

ws.merge_cells('D11:E12')
# Specify 3 colors and rotate 181 degrees
ws['D11'].fill = GradientFill(type='linear', stop=("00FF00","0000FF", "FF0000"), degree=181)

ws.merge_cells('D14:E15')
# Specify 3 colors and rotate 271 degrees
ws['D14'].fill = GradientFill(type='linear', stop=("00FF00","0000FF", "FF0000"), degree=271)


# (B)--------------------------------------------------------------------------------------------
# (B)-➀
#  Rate of change gradient fill➀
# (Variable argument top)

ws.merge_cells('H2:I3')
# top=0.0
ws['H2'].fill = GradientFill(type='path', top="0.0", stop=("00FF00", "000000"))

ws.merge_cells('H5:I6')
# top=0.2
ws['H5'].fill = GradientFill(type='path', top="0.2", stop=("00FF00", "000000"))

ws.merge_cells('H8:I9')
# top=0.5
ws['H8'].fill = GradientFill(type='path', top="0.5", stop=("00FF00", "000000"))

ws.merge_cells('H11:I12')
# top=0.8
ws['H11'].fill = GradientFill(type='path', top="0.8", stop=("00FF00", "000000"))

ws.merge_cells('H14:I15')
# top=1.0
ws['H14'].fill = GradientFill(type='path', top="1.0", stop=("00FF00", "000000"))


# -----------------------------------------------------------------------------------------------
# (B)-➁
#  Rate of change gradient fill➁
# (Variable argument left)

ws.merge_cells('L2:M3')
# left=0.0
ws['L2'].fill = GradientFill(type='path', left="0.0", stop=("00FF00", "000000"))

ws.merge_cells('L5:M6')
# top=0.2
ws['L5'].fill = GradientFill(type='path', left="0.2", stop=("00FF00", "000000"))

ws.merge_cells('L8:M9')
# top=0.5
ws['L8'].fill = GradientFill(type='path', left="0.5", stop=("00FF00", "000000"))

ws.merge_cells('L11:M12')
# top=0.8
ws['L11'].fill = GradientFill(type='path', left="0.8", stop=("00FF00", "000000"))

ws.merge_cells('L14:M15')
# top=1.0
ws['L14'].fill = GradientFill(type='path', left="1.0", stop=("00FF00", "000000"))

# -----------------------------------------------------------------------------------------------
# (B)-➂
# Rate of change gradient fill➂
# (Variable argument left. top)

ws.merge_cells('P6:Q7')
# top=0.5, left=0.5
ws['P6'].fill = GradientFill(type='path', top="0.5", left="0.5", stop=("00FF00", "000000"))

ws.merge_cells('P10:Q11')
# top=0.5, left=0.5
ws['P10'].fill = GradientFill(type='path', top="0.5", left="0.5", stop=("000000", "00FF00"))


wb.save('styles_GradientFill_En.xlsx')
The result of running is as follows
Linear gradients are intuitive and easy to understand. Variation gradients can be customized freely by increasing or decreasing parameters.
Execution results (.xlsx file) can be downloaded here.
1.3 Set Border (Border Object)
To apply rules to a cell, define and create an object of the Border class with the following formatting arguments. Then, apply them with the border property of the target Cell object.
from openpyxl.styles import Border
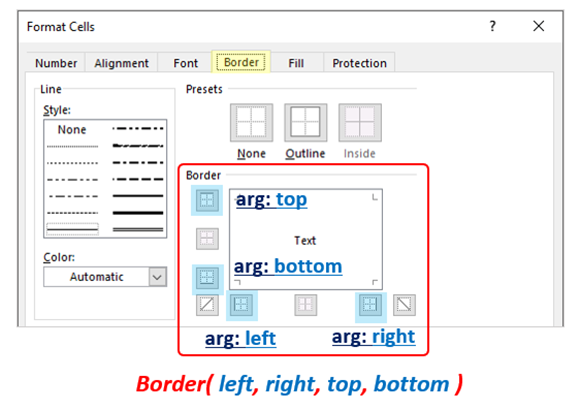
Border(left, right, top, bottom, diagonal, diagonalDown, diagonalUp)
arg: left : Set Side object for border line (left)
arg: right : Set Side object for border line (right)
arg: top : Set Side object for border line (top)
arg: bottom : Set Side object for border line (bottom)
arg: diagonal : Set Side object for border line (diagonal line)
arg: diagonalDown : Set Side object for border line (Right to bottom left diagonal line)
arg: diagonalUp : Set Side object for border line (Right to top left diagonal line)
return: Border Object
※All arguments are optional
It covers all of the items that can be set in the Excel cell formatting window (Border Tab). Fig.11 shows which UI item each argument corresponds to.
The Border class accepts as arg:(left,right,top,bottom) the “Border line definition information (Slide object)” to be set for the top, bottom, left, and right sides of the cell.The Slide object (border line type and color) is explained in the next section.
1.3.1 Definition of Ruled Line (Side Object)
Detailed information such as the type and color of the ruled lines is defined in a Slide object. The object is obtained from the Slide class using the following format
from openpyxl.styles import Side
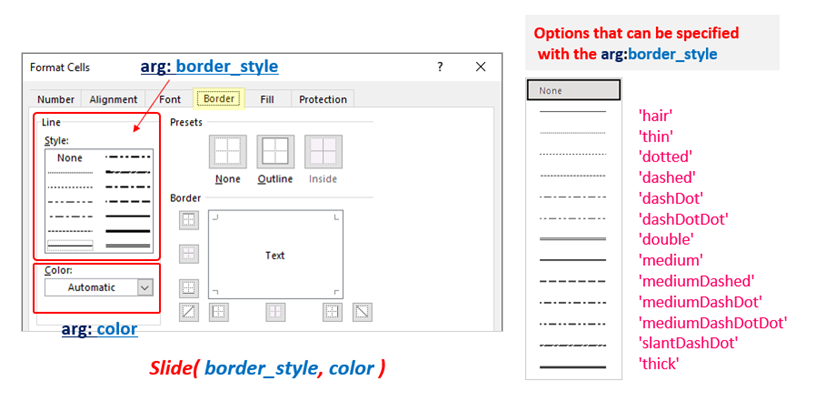
Side(border_style, color)
arg: border_style : Line type setting(default:None)
arg: color : Set line color(default:’FF000000‘)
return: Side Object
※All arguments are optional
The correspondence between Excel’s cell formatting (ruled Tab) and each argument is shown below. (Fig10 left)
The type and color of the border can be specified. The type of border is specified as an optional constant (Enum) in the arg:border_style . As shown in Fig10(right), you can choose from a total of 13 types, including “thin“, “dotted“, etc.
Color can be specified with the arg:color in “α-RGB format” or as a “Color object. (Similar to the Font object, etc.)
【Sample Code (4)】
Now, shows an example code to apply a border (Border(Side) object) to a cell.
The outline of the code is to apply “enclosed border lines” and “diagonal lines” to each cell.
The optional constants for all line types are checked by specifying them in the arg:border_style.
from openpyxl import Workbook
from openpyxl.styles import Border, Side    # Import Border/Side class

wb = Workbook()
ws = wb.active

# List of ruled line types (optional constants)
border_styles = ['hair', 'dashDotDot', 'dashDot', 'thin', 'mediumDashed', 'slantDashDot',
                'dotted', 'dashed', 'medium', 'thick', 'mediumDashDot', 'double', 'mediumDashDotDot']

# List containing line numbers to be processed
row_indexes = [3, 5, 7, 9, 11, 13, 15, 17, 19, 21, 23, 25, 27]


for row_index, border_style in zip(row_indexes, border_styles): # Unpack target line and style list with zip
    for col_index in [2, 3, 5]:   # "Column B, C, E

        if col_index == 2:

            # Set the name of the option constant that specifies the type of line in the cell in column "B".
            ws.cell(row=row_index, column=col_index).value=border_style

        elif col_index == 3:

            # Set a border around the cells in "Column C".
            side_obj = Side(border_style=border_style)
            # Generate a Border object by specifying the Side object as the left, right, top, and bottom of the cell.
            border_obj = Border(left=side_obj, right=side_obj, top=side_obj, bottom=side_obj)
            # Applying a Border object
            ws.cell(row=row_index, column=col_index).border = border_obj

        else:

            # Shaded cells in column "E
            side_obj = Side(border_style=border_style)
            # diagonal* Generate a Border object with arguments
            border_obj = Border(diagonal=side_obj, diagonalDown=True, diagonalUp=True)
            # Applying a Border object
            ws.cell(row=row_index, column=col_index).border = border_obj


wb.save('styles_Border_En.xlsx')
Now, let me explain the key points of the code.
Define a Slide object by setting the optional constants to the arg:border_sytle of the Slide class. Next, set the Slide object to the four arg:left/right/top/bottom (borders in four directions) of the Border class.
Finally, the border property of the Cell object is used to actually reflect the border.
It is almost the same as the border, but this time a diagonal line is set in the definition of the Border object on line 38. The Slide object is specified in the arg:diagonal, and an enable or disable of a diagonal line is specified as “True (enabled)” in the arg:diagonalDown/Up.
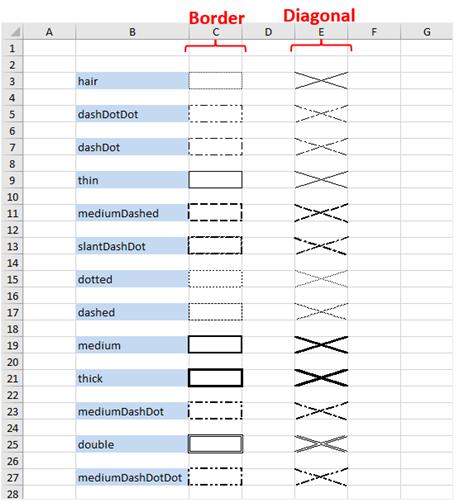
The result of running is as follows
A border was applied to the cells in column C with the Border object. Also, a “diagonal” was applied to column D.Each line type defines a Slide object with the line type name in column A.
All line types have been checked and can be used as a reference.
Execution results (.xlsx file) can be downloaded here.
2. SUMMARY

How was it?
In this article, we have covered the “openpyxl” library for manipulating Excel and how to format cells (fonts, fills and rules).
It is very important to make cells look good. The cell formatting operations described in this article are essential, so please review this article repeatedly to become familiar with them.
Finally, we summarize the main points of this article.
➀.There are dedicated classes related to Excel formatting. Each formatting is set and reflected by each property of the Cell object. Each format object is defined and generated from a dedicated class.
➁.Objects and properties related to cell formatting
・[Font]:Define a Font object and set it with the font attribute of the Cell object.
It covers all the basics of font setting, including bold, italic, underline, as well as
writing style.
・[Fill]:Define a Fill object and set it with the fill attribute of the Cell object.
There are two types of fill effects: “pattern” and “gradient.
・[ruled line]:Define a Border object and set it with the border attribute of the
Cell object.Line types, colors, etc. must be defined separately in the Slide object.
Support for border lines, diagonal lines, etc.
In the next article, we will continue with the second part of cell formatting, which will cover “Display Format,” “Alignment Position,” and “Named Style,” Definitions and How to Apply Them.
The link is here for your reference.
Thank you for reading to the end.